

| << Chapter < Page | Chapter >> Page > |
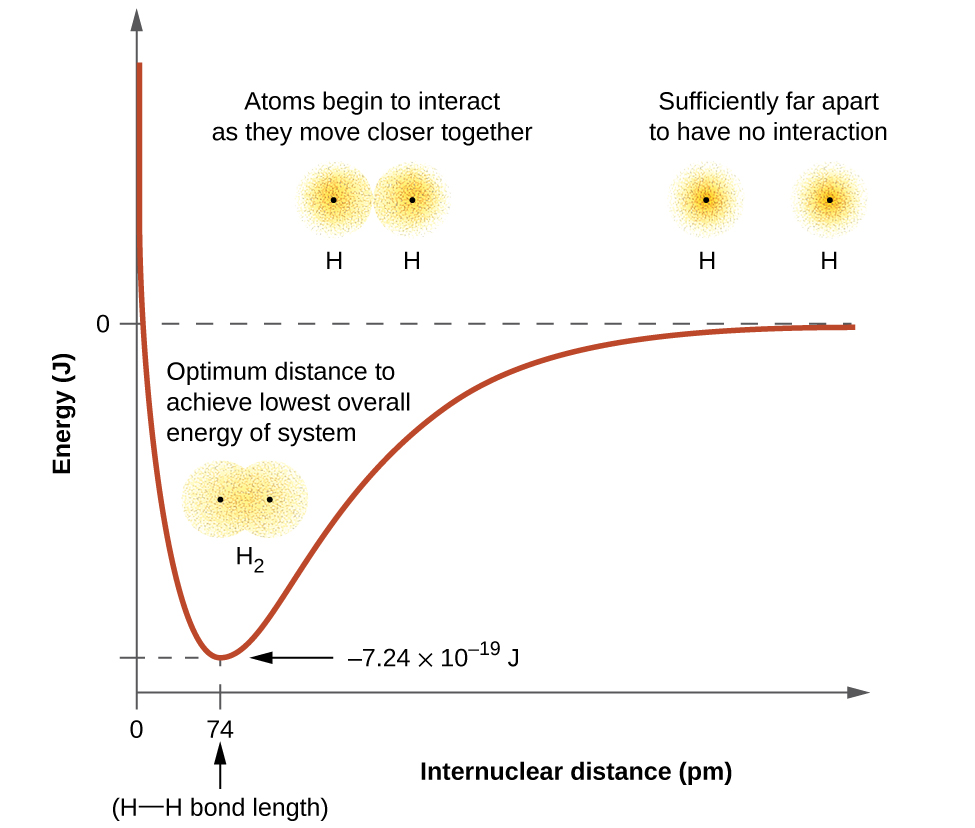
The bond energy is the difference between the energy minimum (which occurs at the bond distance) and the energy of the two separated atoms. This is the quantity of energy released when the bond is formed. Conversely, the same amount of energy is required to break the bond. For the H 2 molecule shown in [link] , at the bond distance of 74 pm the system is 7.24 10 −19 J lower in energy than the two separated hydrogen atoms. This may seem like a small number. However, we know from our earlier description of thermochemistry that bond energies are often discussed on a per-mole basis. For example, it requires 7.24 10 −19 J to break one H–H bond, but it takes 4.36 10 5 J to break 1 mole of H–H bonds. A comparison of some bond lengths and energies is shown in [link] . We can find many of these bonds in a variety of molecules, and this table provides average values. For example, breaking the first C–H bond in CH 4 requires 439.3 kJ/mol, while breaking the first C–H bond in H–CH 2 C 6 H 5 (a common paint thinner) requires 375.5 kJ/mol.
| Representative Bond Energies and Lengths | ||||||
|---|---|---|---|---|---|---|
| Bond | Length (pm) | Energy (kJ/mol) | Bond | Length (pm) | Energy (kJ/mol) | |
| H–H | 74 | 436 | C–O | 140.1 | 358 | |
| H–C | 106.8 | 413 | 119.7 | 745 | ||
| H–N | 101.5 | 391 | 113.7 | 1072 | ||
| H–O | 97.5 | 467 | H–Cl | 127.5 | 431 | |
| C–C | 150.6 | 347 | H–Br | 141.4 | 366 | |
| 133.5 | 614 | H–I | 160.9 | 298 | ||
| 120.8 | 839 | O–O | 148 | 146 | ||
| C–N | 142.1 | 305 | 120.8 | 498 | ||
| 130.0 | 615 | F–F | 141.2 | 159 | ||
| 116.1 | 891 | Cl–Cl | 198.8 | 243 |
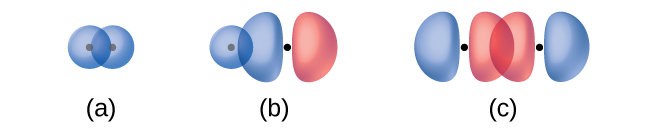
In addition to the distance between two orbitals, the orientation of orbitals also affects their overlap (other than for two s orbitals, which are spherically symmetric). Greater overlap is possible when orbitals are oriented such that they overlap on a direct line between the two nuclei. [link] illustrates this for two p orbitals from different atoms; the overlap is greater when the orbitals overlap end to end rather than at an angle.

The overlap of two s orbitals (as in H 2 ), the overlap of an s orbital and a p orbital (as in HCl), and the end-to-end overlap of two p orbitals (as in Cl 2 ) all produce sigma bonds (σ bonds) , as illustrated in [link] . A σ bond is a covalent bond in which the electron density is concentrated in the region along the internuclear axis; that is, a line between the nuclei would pass through the center of the overlap region. Single bonds in Lewis structures are described as σ bonds in valence bond theory.
A pi bond (π bond) is a type of covalent bond that results from the side-by-side overlap of two p orbitals, as illustrated in [link] . In a π bond, the regions of orbital overlap lie on opposite sides of the internuclear axis. Along the axis itself, there is a node , that is, a plane with no probability of finding an electron.
Notification Switch
Would you like to follow the 'Ut austin - principles of chemistry' conversation and receive update notifications?

|
|

|
|

|
|

|
|

|
|

|
|

|
|

|
|

|
|

|