

| << Chapter < Page | Chapter >> Page > |
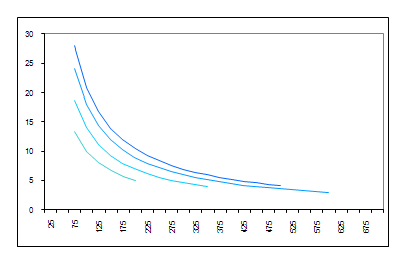
a) Can you say which line applies to which hall? If you use the number of people the hall can accommodate as a clue, it will be easy!
b) Now, use the information supplied to you as well as the graphs and discuss which hall will be the best one for Alan and Sindiswa to choose. Not everybody will get to the same answer, but you must give reasons for your choice.
3 Maybe you recognise this table of test marks of two classes from a previous exercise:
| Group A | 82 | 78 | 57 | 91 | 29 | 80 | 85 | 49 | 82 | 67 | 99 | 68 | 83 | 12 | 87 | 86 | 38 | 81 | 58 | 79 |
| Group B | 72 | 82 | 74 | 84 | 81 | 84 | 76 | 12 | 2 | 71 | 70 | 93 | 13 | 90 | 80 | 73 | 91 | 70 | 99 | 88 |
This can be put on a stem-and-leaf graph, with Group A on the left, and Group B on the right. We separate the tens digits from the units digits, and put the tens digits in the middle, in order. The units then go next to the appropriate tens digit (on the left or the right depending on the group).
Study the graph together with the table to make sure you know how it works.
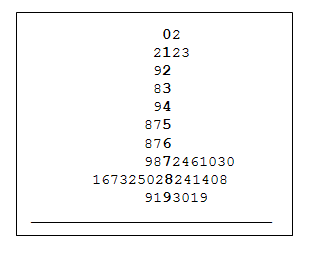
You were given this exercise earlier on to practise your skills in working out averages and finding out more about the differences between the two classes. The stem-and-leaf graph shows a few things we can’t see easily from the table and we can’t find out from the calculations. For example, class A has learners in every symbol class, but Class B has three learners with very poor marks and the rest with very good marks.
On the right is the same information drawn as two sideways bar graphs, one to the right and one to the left.
This is a very common and handy way to show data about two groups you are comparing. Ask your geography teacher about demographic graphs (also called demographic pyramids) in this form. We often find the ages of the population of a country shown with women on one side and men on the other. See if you can find one of these graphs.

ACTIVITY 2
To avoid being fooled by poorly gathered or badly presented statistics
[LO 5.5]
It is easy to draw wrong conclusions from statistics, or to be presented with a graph that has been designed to make you believe something which is not so. Statisticians do a valuable job – we need information, and we need reliable information. Statisticians encounter many problems in assembling and presenting information.
1 One of the first things that can go wrong is in the way we gather that information. Go back to the exercise about TV news viewing. If you ask your questions at filling stations, you are talking to people who own a car (or at least drive one). This means that people who don’t drive have been ignored in your survey. Maybe their answers would have changed the conclusions you came to. You have no way of knowing until you design a better experiment so that no one is excluded.
2. The important principle here is that your sample (the people you ask the question of) must reflect very accurately the general population you want to know about. There are many ways that one can ensure that the sample one chooses is representative. For example, if your school has 1 200 learners and you would like to know how many of them like listening to kwaito, then you could ask 30 and multiply the answer by 40 to get an idea. But it would be no good if all 30 were the same age, or the same race group, or the same sex. A better plan would be to ask the school secretary to help by showing you a list of the learners in alphabetic order. You then pick every fortieth name and write it down. This will give you 30 names. You ask them and then multiply by 40.
Notification Switch
Would you like to follow the 'Mathematics grade 9' conversation and receive update notifications?

|
|

|
|

|
|

|
|

|
|

|
|

|
|

|
|

|
|

|