

| << Chapter < Page | Chapter >> Page > |
MATHEMATICS
Grade 9
NUMBER PATTERNS, GRAPHS, EQUATIONS,
STATISTICS AND PROBABILITY
Module 19
EXTRACT MEANINGFUL INFORMATION FROM DATA
ACTIVITY 1
To be able to extract meaningful information from data
[LO 5.5]
As you know, graphs are to be seen everywhere: in advertisements, in textbooks, in magazine articles and in mathematics classes. In this section we will look at a wide selection of graphs and what we can say about the statistics they represent.
When we have only one set of values (for example the previous study of the breakfast and lunch habits of some learners), we can use a simple graph like a pie chart.
On the other hand, many graphs make a connection between two sets of values. We call this a relation.
Some examples from your previous work are: number of prison inmates in particular years; height above sea level at certain distances from a point; amount charged by a gardener for certain number of hours worked; y–values obtained from x–values substituted into a given formula; etc.
Usually this means that the graph will have a horizontal axis and a vertical axis. Just to remind you, here is the table of important words again:
| Equation: | x | y |
| Equation: | Independent variable | Dependent variable |
| Flow diagram: | Input value | Output value |
| Table: | First row | Second row |
| Coordinates: | 1st coordinate | 2nd coordinate |
| Graph: | x- axis | y- axis |
| Graph: | Horizontal axis | Vertical axis |
1 James and Gabriel are the same age – they are friends, both entering their first job at the start of January 2000. Each of them can easily take a bus to work. Each also has enough money from their holiday jobs to use as a deposit on a new car.
James wants a new car immediately, and now that he has a job, he arranges hire purchase financing for a car. He has enough for the deposit, and he can just about afford the monthly repayments. At the end of four years he replaces the car with another new one, a slightly nicer model. He again buys it on hire purchase, paying the deposit from the sale of his old car, and pays the higher instalments regularly. At the start of 2008, he does the same. Every four years he replaces his car.
Gabriel is willing to do something different. Instead of getting a new car immediately, he puts the money he would have used for the deposit into a savings account and saves up enough every month so that after four years he can buy a new car for cash. So in 2004 he chooses the same one his friend James does. Immediately he starts another savings account, making monthly payments big enough for a new car in four years’ time like the one his friend buys then. In 2008, he sells his old car when he gets the new one, and puts the money in the bank to start his savings for the next car. So he also replaces his car every four years
In other words, from 2004 they drive exactly the same cars!
The information about their expenditure is given below as a bar graph as well as a table.
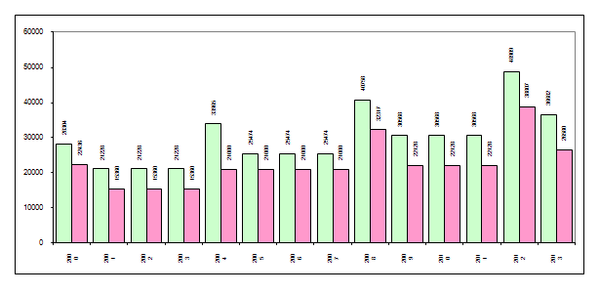
| Year | 2000 | 2001 | 2002 | 2003 | 2004 | 2005 | 2006 | 2007 | 2008 | 2009 | 2010 | 2011 | 2012 | 2013 |
| James | 28 304 | 21 228 | 21 228 | 21 228 | 33 965 | 25 474 | 25 474 | 25 474 | 40 758 | 30 568 | 30 568 | 30 568 | 48 909 | 36 682 |
| Gabriel | 22 436 | 15 360 | 15 360 | 15 360 | 21 000 | 21 000 | 21 000 | 21 000 | 32 317 | 22 128 | 22 128 | 22 128 | 38 807 | 26 580 |
Notification Switch
Would you like to follow the 'Mathematics grade 9' conversation and receive update notifications?

|
|

|
|
|
|
|

|
|

|
|

|
|

|
|

|
|

|
|

|