

| << Chapter < Page | Chapter >> Page > |
Other greenhouse gases progress through their respective cycles much more slowly than water. There are vast amounts of carbon and carbon dioxide in the earth-atmosphere system. Most carbon is locked up in rocks, where it may remain for millions of years. The carbon dioxide that is mobile, however, is mostly found in other places: the ocean, soils, vegetation, fossil fuels like coal, oil, and natural gas, and also in small concentrations in the atmosphere. These reservoirs of CO 2 can exchange mass like oceans and clouds do in the water cycle, but with one extremely important difference–the exchange rate is much slower. That means the system can get out of balance and remain out of balance for a long time, hundreds or thousands of years. There are two primary mechanisms for sequestering carbon dioxide that is released into the atmosphere: it can be captured by the respiration of plants, or dissolved in the ocean.
However, the rate at which plants and oceans can take CO 2 out of the atmosphere is fixed. Therefore, if a surplus of CO 2 is added to the atmosphere, it will stay there for a long time. This has major implications, given the fact that CO 2 is a powerful greenhouse gas. The question then to ask becomes, “is this exchange rate out of balance?”
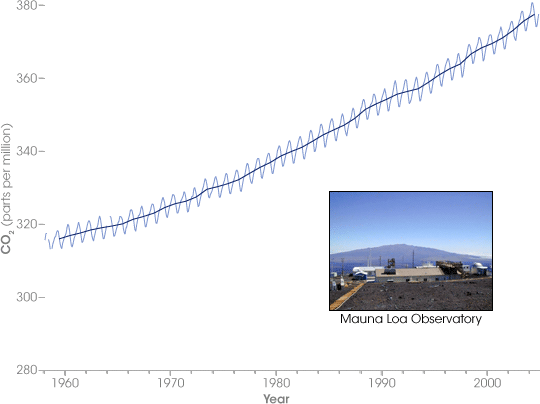
The current average concentration of CO 2 in the atmosphere is about 390 parts per million (PPM), which means there are 390 parts of CO 2 per million parts of air. That does not seem like very much, but if that small amount of carbon dioxide were removed from the air, the global average temperature would plummet. Has this concentration been changing? To answer the question, we will turn to the findings of Richard Keeling, whose life’s work was the observation of CO 2 concentrations at the Mauna Loa Observatory in Hawaii. Beginning in the early 1950s, observations of CO 2 , a well-mixed gas in our atmosphere, have shown a remarkable climb in concentration. (see Figure CO 2 Concentrations at the Mauna Loa Observatory ) The “Keeling Curve,” as it is sometimes called, clearly shows that since the 1950s CO 2 concentrations have increased steadily from 315 ppm to 390 ppm. The zigzag nature of this graph is due to life cycle of plants in the NH. The NH has much more land area that the SH, so when spring and summer arrive in the NH, the abundance of new plant life reduces the CO 2 concentrations in the atmosphere. When the plants die or become dormant in the fall and winter, CO 2 concentrations spike again.
What is troublesome about this figure is that the carbon cycle is out of its normal rhythm and a surplus of CO 2 , a known greenhouse gas, is building in the earth’s atmosphere. Where is this surplus coming from? To answer this question, let’s look at two historical records of CO 2 concentrations taken from ice core deposits. The top panel in Figure Changes in Greenhouse Gases from Ice Core and Modern Data shows the past 10,000 years of atmospheric CO 2 concentrations. Before 1750, the amount of CO 2 in the atmosphere was relatively steady at 280 ppm. Since 1750 there has been a dramatic increase in CO 2 concentrations.
Notification Switch
Would you like to follow the 'Sustainability: a comprehensive foundation' conversation and receive update notifications?

|
|

|
|

|
|

|
|

|
|
|
|
|

|
|

|
|

|
|

|