<< Chapter < Page Chapter >> Page >
Ice Age Temperature
Ice Age Temperature The blue and green lines depict two different Antarctic ice cores (taken from ice about 350 miles apart) and the variations in oxygen isotopes are converted into temperature changes. The red line depicts global ice volume. The y-axis shows temperature change; today's climate is at zero – the dashed line. Source: Robert A. Rohde
Five Myr Climate Change
Five Myr Climate Change A comparison of the age of sediment (x-axis) and the change in temperature over time (left y-axis) as derived from oxygen isotope ratios (right y-axis). The dashed line shows today's climate. Note that the climate is cooling over the last few million years, but it is highly variable. In the last one million years the climate alternates between warm and cool conditions on a 100,000-year time scale ("100 kyr cycle"), before this it alternated on a 41,000 year cycle. Both these period lengths are the same as Milankovitch cycles. These cores suggest that today's temperature is higher than almost all of that of the Quaternary (the last 2.6 Million years). Source: Jo Weber

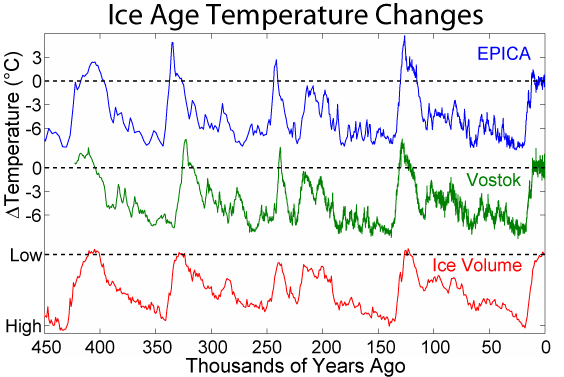
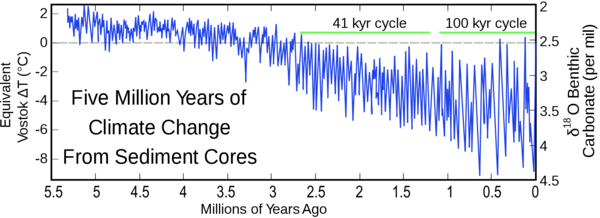
The changes in climate recorded in ice sheets are thought to be worldwide. The same climate changes observed in Antarctica are also found in cores taken from Greenland, which is on the other side of the Earth. Isotope data can also be taken from sediment cored from the ocean floor—all over the planet—and these cores also show the same changes in climate, alternating between cold and warm. Because ocean sediment is deposited over millions of years, the sediment can give an indication of the climate across the whole of the Quaternary and beyond. Figure Five Myr Climate Change shows how temperature has changed over time (blue line), compared with today (dashed line). The temperature has, on average, gotten colder over the Quaternary, but it also appears to oscillate between warm and cold periods. We'll investigate these periodic changes in the next section of this chapter.

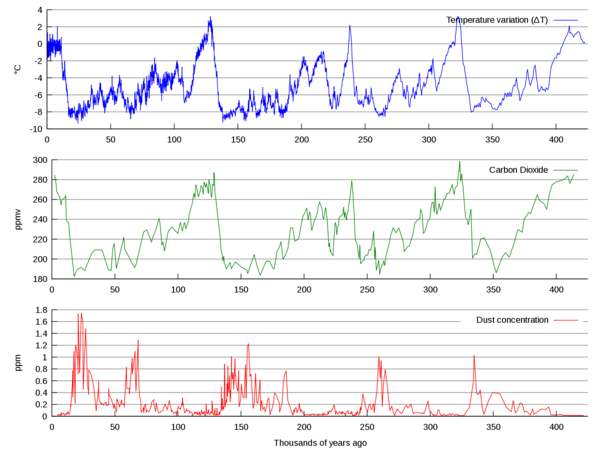
As falling snow accumulates on the ground, tiny bubbles of air become trapped in it. These bubbles are retained as the snow transforms to ice, and constitute tiny samples of the ancient atmosphere that can be analyzed to find out if the changes in temperature (as recorded in the oxygen isotopes) are related to changes in the atmosphere. The temperature recorded by the isotopes in the ice is directly related to the amount of carbon dioxide in the trapped air (Figure Vostok Petit Data ): the times with higher carbon dioxide are also times of high temperature.

Falling snow also captures and entombs atmospheric dust, which is topsoil born aloft by the wind, and which is especially prevalent during droughts. The fact that more dust occurs in the ice accumulated during cold periods suggests that the glacial climate was dry, as well as cold.

Vostok Petit Data
Vostok Petit Data These graphs depict how changes in temperature—inferred from changes in isotope ratios (blue line)--correspond to changes in atmospheric carbon dioxide (green line) and dust (red line) over the last 400,000 years as recorded in an ice core extracted from Antarctica. Carbon dioxide varies directly with temperature – the warmer the climate the higher the carbon dioxide level. Atmospheric dust is highest during the coolest periods (such as 25,000 and 150,000 years ago). Source: William M. Connolley produced figure using data from the National Oceanic and Atmospheric Administration, U.S. Department of Commerce, Paleoclimatology branch, Vostok Ice Core Data.

Get Jobilize Job Search Mobile App in your pocket Now!

Get it on Google Play Download on the App Store Now


Source:  OpenStax, Sustainability: a comprehensive foundation. OpenStax CNX. Nov 11, 2013 Download for free at http://legacy.cnx.org/content/col11325/1.43
Google Play and the Google Play logo are trademarks of Google Inc.

Notification Switch

Would you like to follow the 'Sustainability: a comprehensive foundation' conversation and receive update notifications?

Ask