<< Chapter < Page
  Wiskunde graad 7   Page 1 / 1
Chapter >> Page >

Wiskunde

Persentasies

Opvoeders afdeling

Memorandum

  • a) (i) 1 8 size 12{ { { size 8{1} } over { size 8{8} } } } {} / 12 , 5 100 size 12{ { { size 8{"12",5} } over { size 8{"100"} } } } {} / 125 1000 size 12{ { { size 8{"125"} } over { size 8{"1000"} } } } {}

(ii) 3 20 size 12{ { { size 8{3} } over { size 8{"20"} } } } {}

  1. 15

( 1 4 size 12{ { { size 8{1} } over { size 8{4} } } } {} van 60)

  1. 9

(15–6)

22.2 a) 1 10 size 12{ { { size 8{1} } over { size 8{"10"} } } } {} van 24 = 2,4

2 uur 24 minute

b) Veldwerk

Fiksheid

c) 1 8 size 12{ { { size 8{1} } over { size 8{8} } } } {}

  1. 3,6 uur

3 uur 36 minute

Leerders afdeling

Inhoud

Aktiwiteit: sirkelgrafieke met persentasie (%) [lu 2.6, lu 5.8, lu 5.9]

22. SIRKELGRAFIEKE MET PERSENTASIE (%)

22.1 Bestudeer die volgende sirkelgrafiek saam met ’n maat en beantwoord dan die vrae wat volg:

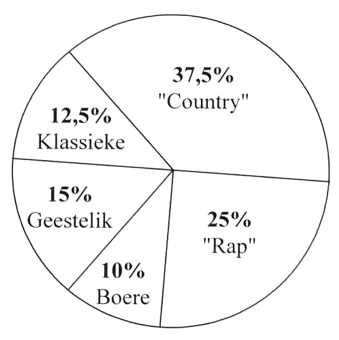
’n Graad 7-klas se musieksmaak lyk so:

a) Watter breuk van die leerders hou van

(i) klassieke musiek? .........................

(ii) geestelike musiek? .........................

b) As daar 60 leerders in die klas is, hoeveel luister na “rap”?

…………………………………………………………………………………………..

…………………………………………………………………………………………..

c) Hoeveel minder leerders luister na Boeremusiek as na “rap”?

…………………………………………………………………………………………..

…………………………………………………………………………………………..

d) Wat is JOU gunsteling musiek?

…………………………………………………………………………………………..

22.2 Kyk ook na die sirkelgrafiek in verband met die Suid-Afrikaanse krieketspan se daaglikse roetine. Beantwoord die volgende vrae:

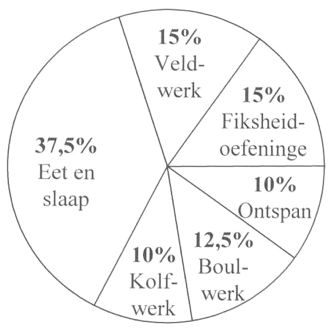
a) Hoeveel uur is daar per dag vir ontspanning?

…………………………………………………………………………………………..

…………………………………………………………………………………………..

b) Waaraan word daar ewe veel tyd spandeer?

…………………………………………………………………………………………..

…………………………………………………………………………………………..

c) Watter breuk van die dag word aan boulwerk bestee?

…………………………………………………………………………………………..

…………………………………………………………………………………………..

d) Hoeveel uur per dag word aan fiksheidsoefeninge afgestaan?

…………………………………………………………………………………………..

…………………………………………………………………………………………..

23. UITDAGING!

Kan jy ’n kolomgrafiek trek van enige van die bogenoemde sirkelgrafieke?

24. Tyd vir self-assessering

  • Maak ’n regmerkie in die toepaslike kolom:
JA NEE
Ek kan % van bedrae bereken (nr. 15.1 – 15.3)
Ek kan een hoeveelheid as ’n % van ’n ander hoeveelheid skryf (nr. 16.1 – 16.3)
Ek kan % afslag bereken
Ek kan % verhoging bereken
Ek kan wins bereken
Ek kan verlies bereken
Ek kan die BTW op items bereken
Ek kan sirkelgrafieke interpreteer en vrae daaroor beantwoord
Ek kan ’n kolomgrafiek trek

Assessering

Leeruitkomste 2: Die leerder is in staat om patrone en verwantskappe te herken, te beskryf en voor te stel en probleme op te los deur algebraïese taal en vaardighede te gebruik.

Assesseringstandaard 2.6: Dit is duidelik wanneer die leerder ‘n situasie beskryf deur ‘n grafiek daarvan te interpreteer, of ‘n grafiek van ‘n beskrywing van ‘n situasie teken (bv. die hoogte van ‘n wipwaentjie oor tyd; die spoed van ‘n resiesmotor wat om ‘n baan beweeg);

Leeruitkomste 5: Die leerder is in staat om data te versamel, op te som, voor te stel en krities te ontleed om gevolgtrekkings en voorspellings te maak en om toevallige variasie te interpreteer en te bepaal.

Assesseringstandaard 5.8: Dit is duidelik wanneer die leerder ‘n verskeidenheid grafieke met die hand of met behulp van tegnologie teken om data voor te stel en te interpreteer (gegroepeer en ongegroepeer),

Assesseringstandaard 5.9: Dit is duidelik wanneer die leerder data wat op verskeie maniere voorgestel is krities lees en interpreteer ten einde gevolgtrekkings en voorspellings te maak.

Questions & Answers

differentiate between demand and supply giving examples
Lambiv Reply
differentiated between demand and supply using examples
Lambiv
what is labour ?
Lambiv
how will I do?
Venny Reply
how is the graph works?I don't fully understand
Rezat Reply
information
Eliyee
devaluation
Eliyee
t
WARKISA
hi guys good evening to all
Lambiv
multiple choice question
Aster Reply
appreciation
Eliyee
explain perfect market
Lindiwe Reply
In economics, a perfect market refers to a theoretical construct where all participants have perfect information, goods are homogenous, there are no barriers to entry or exit, and prices are determined solely by supply and demand. It's an idealized model used for analysis,
Ezea
What is ceteris paribus?
Shukri Reply
other things being equal
AI-Robot
When MP₁ becomes negative, TP start to decline. Extuples Suppose that the short-run production function of certain cut-flower firm is given by: Q=4KL-0.6K2 - 0.112 • Where is quantity of cut flower produced, I is labour input and K is fixed capital input (K-5). Determine the average product of lab
Kelo
Extuples Suppose that the short-run production function of certain cut-flower firm is given by: Q=4KL-0.6K2 - 0.112 • Where is quantity of cut flower produced, I is labour input and K is fixed capital input (K-5). Determine the average product of labour (APL) and marginal product of labour (MPL)
Kelo
yes,thank you
Shukri
Can I ask you other question?
Shukri
what is monopoly mean?
Habtamu Reply
What is different between quantity demand and demand?
Shukri Reply
Quantity demanded refers to the specific amount of a good or service that consumers are willing and able to purchase at a give price and within a specific time period. Demand, on the other hand, is a broader concept that encompasses the entire relationship between price and quantity demanded
Ezea
ok
Shukri
how do you save a country economic situation when it's falling apart
Lilia Reply
what is the difference between economic growth and development
Fiker Reply
Economic growth as an increase in the production and consumption of goods and services within an economy.but Economic development as a broader concept that encompasses not only economic growth but also social & human well being.
Shukri
production function means
Jabir
What do you think is more important to focus on when considering inequality ?
Abdisa Reply
any question about economics?
Awais Reply
sir...I just want to ask one question... Define the term contract curve? if you are free please help me to find this answer 🙏
Asui
it is a curve that we get after connecting the pareto optimal combinations of two consumers after their mutually beneficial trade offs
Awais
thank you so much 👍 sir
Asui
In economics, the contract curve refers to the set of points in an Edgeworth box diagram where both parties involved in a trade cannot be made better off without making one of them worse off. It represents the Pareto efficient allocations of goods between two individuals or entities, where neither p
Cornelius
In economics, the contract curve refers to the set of points in an Edgeworth box diagram where both parties involved in a trade cannot be made better off without making one of them worse off. It represents the Pareto efficient allocations of goods between two individuals or entities,
Cornelius
Suppose a consumer consuming two commodities X and Y has The following utility function u=X0.4 Y0.6. If the price of the X and Y are 2 and 3 respectively and income Constraint is birr 50. A,Calculate quantities of x and y which maximize utility. B,Calculate value of Lagrange multiplier. C,Calculate quantities of X and Y consumed with a given price. D,alculate optimum level of output .
Feyisa Reply
Answer
Feyisa
c
Jabir
the market for lemon has 10 potential consumers, each having an individual demand curve p=101-10Qi, where p is price in dollar's per cup and Qi is the number of cups demanded per week by the i th consumer.Find the market demand curve using algebra. Draw an individual demand curve and the market dema
Gsbwnw Reply
suppose the production function is given by ( L, K)=L¼K¾.assuming capital is fixed find APL and MPL. consider the following short run production function:Q=6L²-0.4L³ a) find the value of L that maximizes output b)find the value of L that maximizes marginal product
Abdureman
types of unemployment
Yomi Reply
What is the difference between perfect competition and monopolistic competition?
Mohammed
Got questions? Join the online conversation and get instant answers!
Jobilize.com Reply

Get Jobilize Job Search Mobile App in your pocket Now!

Get it on Google Play Download on the App Store Now


Source:  OpenStax, Wiskunde graad 7. OpenStax CNX. Oct 21, 2009 Download for free at http://cnx.org/content/col11076/1.2
Google Play and the Google Play logo are trademarks of Google Inc.

Notification Switch

Would you like to follow the 'Wiskunde graad 7' conversation and receive update notifications?

Ask