<< Chapter < Page Chapter >> Page >

Mathematics

Grade 4

Measurement, space and shape

Module 11

Visualise and name 3-dimensional objects in the environment

Activity 1:

To recognise, visualise and name 3-dimensional objects in the environment [LO 3.1]

To describe, sort and compare them [LO 3.2]

Prisms, rectangular prisms, spheres, cylinders, pyramids, and other objects are found all round us.

1. Study the following three-dimensional objects in order to learn their names and be able to recognize and name similar objects in the world around us:

2. Objects in the world around us: now try to draw and name the 3-D objects:

Item Drawing Geometrical name of the object
Cricket ball
Cube of sugar (lump)
Tin of dog-food
Ice-cream cone
Box of matches
Packet of cornflakes
Triangular box of sweets

3. More shapes and objects.

3.1 Write each of the following solid objects under the correct geometrical heading: The sun; a string of spaghetti; a block of ice; an ordinary candle; the handle of a garden rake; a book; an orange; a brick; a block of margarine. Think of others and write them in the columns too, especially the columns that seem to be rather empty.

3.2 Compare your lists with those of your friends. If they have an item that you have not thought of, you may add it to your list.

Sphere Cylinder Cube Cuboid (rectangular prism) Pyramid Cone

. Write the correct geometrical name next to each of the following:

  • a block of flats
  • the walls of a rondavel
  • a wigwam/tepee
  • the roof of a rondavel
  • the stones at Stonehenge

5. Look at the objects again. How many surfaces are there? Are the surfaces flat or curved? What shape are the surfaces? Fill in the missing words to describe the objects:

Object Number of surfaces Flat or curved surfaces Shape of surfaces
A box of cornflakes
A ball
A cube of sugar
A candle
A pyramid Sides:Base:

Activity 2:

  • To recognise, visualise and name 2-D shapes and 3-D objects in the environment [LO 3.1]
  • To describe, sort and compare 2-D shapes and 3-D objects from the environment [LO 3.2]
  • To make 2-D shapes, 3-D objects and patterns from tangrams [LO 3.5]
  • Two-dimensional shapes are flat. We can draw them on a piece of paper . Polygons are all closed geometric shapes with straight sides.
  1. Polygons : Use your pencil and ruler to practise drawing these.

3 sides: Triangles

4 sides: Quadrilaterals

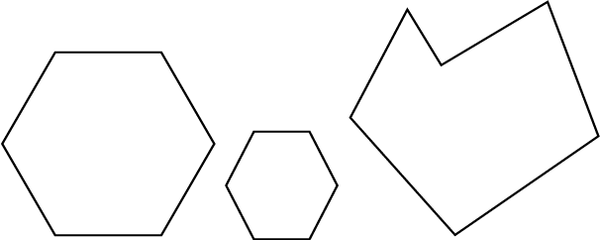
5 sides: Pentagons (when all the sides are equal in length, it is a regular pentagon; if they are different lengths, it is an irregular pentagon)

6 sides: Hexagons

7 sides: Heptagons

(Try to draw one regular heptagon.)

2. Circles

2.1 Circles are not polygons. Look at the circle below and compare it with the polygons that we have discussed:

  • Complete: The circle is not a polygon because __________________________
  • Now try to think of an example of each shape that we have considered, in your environment. Remember, they must all be flat because they are two-dimensional. In each shape below, fill in the road signs that you have seen in the world around you and on the way to school.

3.1 The Circle

3.2 The Triangle

3.3 The Square

3.4 The Rectangle

3.5 The Octogon

4. Cut out the TANGRAM on the next page. Cut out all the shapes in it.

Questions & Answers

What are the factors that affect demand for a commodity
Florence Reply
differentiate between demand and supply giving examples
Lambiv Reply
differentiated between demand and supply using examples
Lambiv
what is labour ?
Lambiv
how will I do?
Venny Reply
how is the graph works?I don't fully understand
Rezat Reply
information
Eliyee
devaluation
Eliyee
t
WARKISA
hi guys good evening to all
Lambiv
multiple choice question
Aster Reply
appreciation
Eliyee
explain perfect market
Lindiwe Reply
In economics, a perfect market refers to a theoretical construct where all participants have perfect information, goods are homogenous, there are no barriers to entry or exit, and prices are determined solely by supply and demand. It's an idealized model used for analysis,
Ezea
What is ceteris paribus?
Shukri Reply
other things being equal
AI-Robot
When MP₁ becomes negative, TP start to decline. Extuples Suppose that the short-run production function of certain cut-flower firm is given by: Q=4KL-0.6K2 - 0.112 • Where is quantity of cut flower produced, I is labour input and K is fixed capital input (K-5). Determine the average product of lab
Kelo
Extuples Suppose that the short-run production function of certain cut-flower firm is given by: Q=4KL-0.6K2 - 0.112 • Where is quantity of cut flower produced, I is labour input and K is fixed capital input (K-5). Determine the average product of labour (APL) and marginal product of labour (MPL)
Kelo
yes,thank you
Shukri
Can I ask you other question?
Shukri
what is monopoly mean?
Habtamu Reply
What is different between quantity demand and demand?
Shukri Reply
Quantity demanded refers to the specific amount of a good or service that consumers are willing and able to purchase at a give price and within a specific time period. Demand, on the other hand, is a broader concept that encompasses the entire relationship between price and quantity demanded
Ezea
ok
Shukri
how do you save a country economic situation when it's falling apart
Lilia Reply
what is the difference between economic growth and development
Fiker Reply
Economic growth as an increase in the production and consumption of goods and services within an economy.but Economic development as a broader concept that encompasses not only economic growth but also social & human well being.
Shukri
production function means
Jabir
What do you think is more important to focus on when considering inequality ?
Abdisa Reply
any question about economics?
Awais Reply
sir...I just want to ask one question... Define the term contract curve? if you are free please help me to find this answer 🙏
Asui
it is a curve that we get after connecting the pareto optimal combinations of two consumers after their mutually beneficial trade offs
Awais
thank you so much 👍 sir
Asui
In economics, the contract curve refers to the set of points in an Edgeworth box diagram where both parties involved in a trade cannot be made better off without making one of them worse off. It represents the Pareto efficient allocations of goods between two individuals or entities, where neither p
Cornelius
In economics, the contract curve refers to the set of points in an Edgeworth box diagram where both parties involved in a trade cannot be made better off without making one of them worse off. It represents the Pareto efficient allocations of goods between two individuals or entities,
Cornelius
Suppose a consumer consuming two commodities X and Y has The following utility function u=X0.4 Y0.6. If the price of the X and Y are 2 and 3 respectively and income Constraint is birr 50. A,Calculate quantities of x and y which maximize utility. B,Calculate value of Lagrange multiplier. C,Calculate quantities of X and Y consumed with a given price. D,alculate optimum level of output .
Feyisa Reply
Answer
Feyisa
c
Jabir
the market for lemon has 10 potential consumers, each having an individual demand curve p=101-10Qi, where p is price in dollar's per cup and Qi is the number of cups demanded per week by the i th consumer.Find the market demand curve using algebra. Draw an individual demand curve and the market dema
Gsbwnw Reply
suppose the production function is given by ( L, K)=L¼K¾.assuming capital is fixed find APL and MPL. consider the following short run production function:Q=6L²-0.4L³ a) find the value of L that maximizes output b)find the value of L that maximizes marginal product
Abdureman
Got questions? Join the online conversation and get instant answers!
Jobilize.com Reply

Get Jobilize Job Search Mobile App in your pocket Now!

Get it on Google Play Download on the App Store Now


Source:  OpenStax, Mathematics grade 4. OpenStax CNX. Sep 18, 2009 Download for free at http://cnx.org/content/col11101/1.1
Google Play and the Google Play logo are trademarks of Google Inc.

Notification Switch

Would you like to follow the 'Mathematics grade 4' conversation and receive update notifications?

Ask