<< Chapter < Page Chapter >> Page >
Problem Set for Graphing with MATLAB

Plot y a b x , using the specified coefficients and ranges (use increments of 0.1):

  1. a 2 , b 0.3 for 0 x 5
  2. a 3 , b 0 for 0 x 10
  3. a 4 , b -0.3 for 0 x 15

  1. a=2; b=.3; x=[0:.1:5]; y=a+b*x;plot(x,y),title('Graph of y=a+bx'),xlabel('x'),ylabel('y'),grid
  2. a=3; b=.0; x=[0:.1:10]; y=a+b*x;plot(x,y),title('Graph of y=a+bx'),xlabel('x'),ylabel('y'),grid
  3. a=2; b=.3; x=[0:.1:5]; y=a+b*x;plot(x,y),title('Graph of y=a+bx'),xlabel('x'),ylabel('y'),grid

Plot the following functions, using increments of 0.01 and a 6 , b 0.8 , 0 x 5 :

  1. y a x b
  2. y a x b
  3. y a x

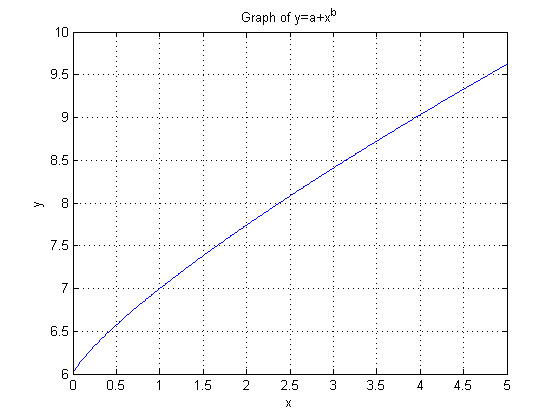
  1. a=6; b=.8; x=[0:.01:5]; y=a+x.^b;plot(x,y),title('Graph of y=a+x^b'),xlabel('x'),ylabel('y'),grid 2a
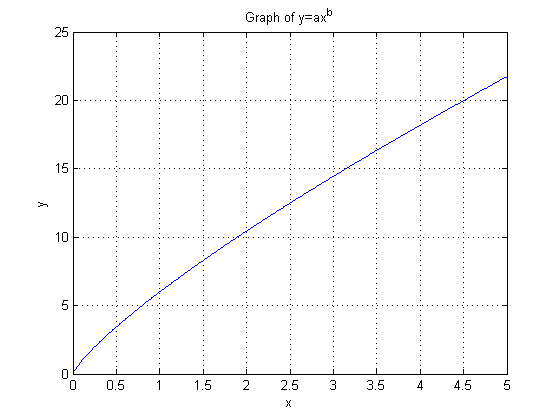
  2. a=6; b=.8; x=[0:.01:5]; y=a*x.^b;plot(x,y),title('Graph of y=ax^b'),xlabel('x'),ylabel('y'),grid 2a
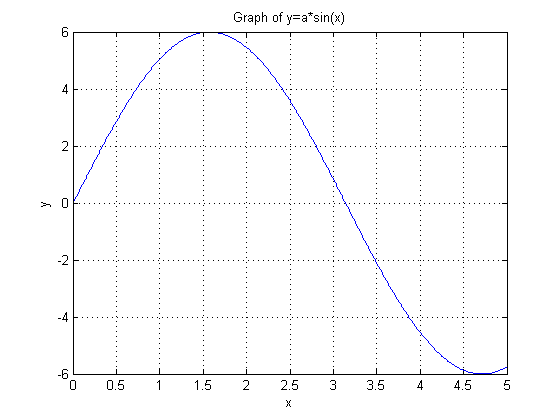
  3. a=6; x=[0:.01:5]; y=a*sin(x);plot(x,y),title('Graph of y=a*sin(x)'),xlabel('x'),ylabel('y'),grid
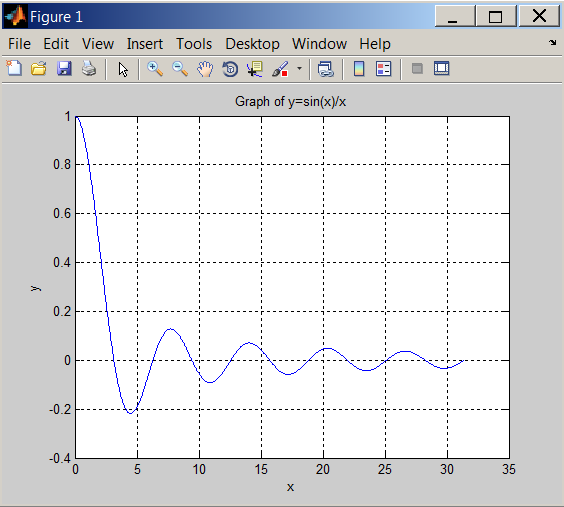
 2a

Plot function y x x for 100 x 10 using increments of 100

x = pi/100:pi/100:10*pi; y = sin(x)./x;plot(x,y),title('Graph of y=sin(x)/x'),xlabel('x'),ylabel('y'),grid

PlotExercise
Graph of y x x

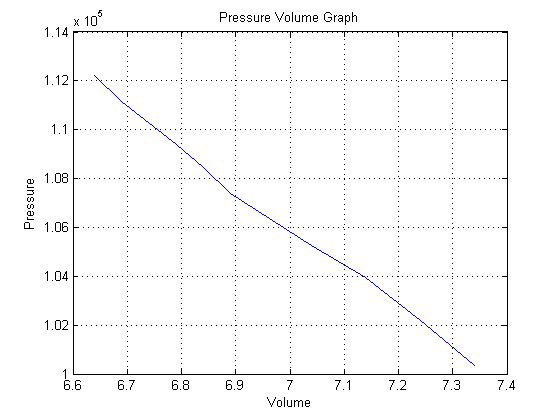
Data collected from Boyle's Law experiment are as follows: (Data available for download. )

Volume [cm^3] Pressure [Pa]
7.34 100330
7.24 102200
7.14 103930
7.04 105270
6.89 107400
6.84 108470
6.79 109400
6.69 111140
6.64 112200
Plot a graph of Pressure vs Volume, annotate your graph.

Pressure=[100330,102200,103930,105270,107400,108470,109400,111140,112200];Volume=[7.34,7.24,7.14,7.04,6.89,6.84,6.79,6.69,6.64];plot(Volume, Pressure),title('Pressure Volume Graph'),xlabel('Volume'),ylabel('Pressure'),grid PV Graph

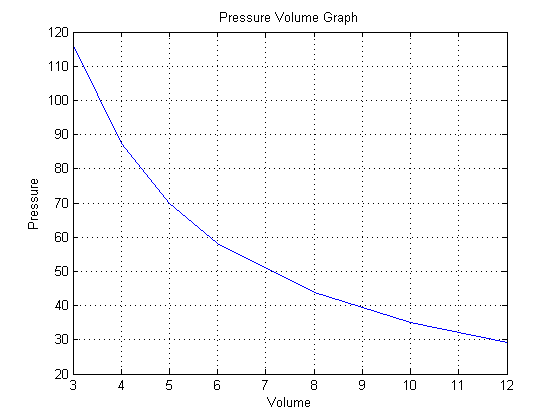
The original data collected from Boyle's Introduction to Engineering: Modeling and Problem Solving by J. B. Brockman, John Wiley and Sons, Inc. © 2009, (p.246) experiment are as follows: (Data available for download. )

Volume [tube-inches] Pressure [inches-Hg]
12 29.125
10 35.000
8 43.688
6 58.250
5 70.000
4 87.375
3 116.500
Plot a graph of Pressure vs Volume, annotate your graph.

>>P=[29.125,35,43.688,58.25,70,87.375,116.5];>>V=[12,10,8,6,5,4,3];>>plot(V,P),title('Pressure Volume Graph'),xlabel('Volume'),ylabel('Pressure'),grid PV Graph

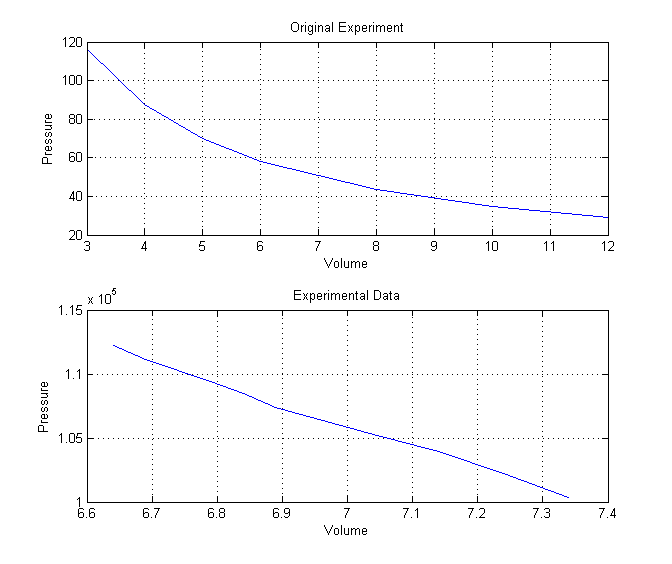
Display the two plots created earlier in one plot.

PV Graph

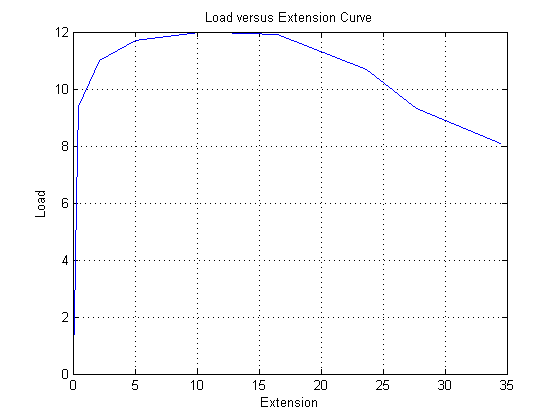
A tensile test of SAE 1020 steel produced the data below (Data available for download. ) Introduction to Materials Science for Engineers | Instructor's Manual by J. F. Shackelford, Macmillan Publishing Company. © 1992, (p.440) experiment are as follows:

Extension [mm] Load [kN]
0.00 0.0
0.09 1.9
0.31 6.1
0.47 9.4
2.13 11.0
5.05 11.7
10.50 12.0
16.50 11.9
23.70 10.7
27.70 9.3
34.50 8.1
Plot a graph of Load vs Extension, annotate your graph.

Extension=[0.00,0.09,0.31,0.47,2.13,5.05,10.50,16.50,23.70,27.70,34.50];Load=[0.0,1.9,6.1,9.4,11.0,11.7,12.0,11.9,10.7,9.3,8.1];plot(Extension, Load),title('Load versus Extension Curve'),xlabel('Extension'),ylabel('Load'),grid LoadVsExtension

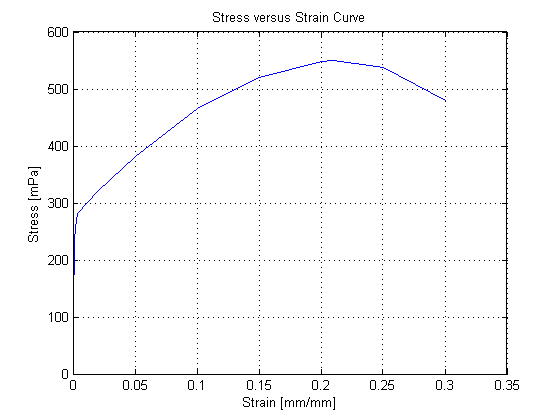
Given below is Stress-Strain data for a type 304 stainless steel. Introduction to Materials Science for Engineers by J. F. Shackelford, Macmillan Publishing Company. © 1985, (p.304) experiment are as follows: (Data available for download. )

Stress [MPa] Strain [mm/mm]
0.0 0.0000
38.6 0.0002
77.2 0.0004
115.8 0.0006
154.4 0.0008
193.0 0.0010
218.0 0.0012
232.0 0.0014
258.0 0.0020
268.0 0.0025
273.0 0.0030
278.0 0.0035
282.0 0.0040
320.0 0.0200
382.0 0.0500
466.0 0.1000
520.0 0.1500
548.0 0.2000
550.0 0.2100
538.0 0.2500
480.0 0.3000
Plot a graph of Stress vs Strain, annotate your graph.

The data can be entered using Variable Editor:

variables

Then execute the following:
plot(Strain,Stress),title('Stress versus Strain Curve'),xlabel('Strain [mm/mm]'),ylabel('Stress [mPa]'),grid
StressStrain

Questions & Answers

how does Neisseria cause meningitis
Nyibol Reply
what is microbiologist
Muhammad Reply
what is errata
Muhammad
is the branch of biology that deals with the study of microorganisms.
Ntefuni Reply
What is microbiology
Mercy Reply
studies of microbes
Louisiaste
when we takee the specimen which lumbar,spin,
Ziyad Reply
How bacteria create energy to survive?
Muhamad Reply
Bacteria doesn't produce energy they are dependent upon their substrate in case of lack of nutrients they are able to make spores which helps them to sustain in harsh environments
_Adnan
But not all bacteria make spores, l mean Eukaryotic cells have Mitochondria which acts as powerhouse for them, since bacteria don't have it, what is the substitution for it?
Muhamad
they make spores
Louisiaste
what is sporadic nd endemic, epidemic
Aminu Reply
the significance of food webs for disease transmission
Abreham
food webs brings about an infection as an individual depends on number of diseased foods or carriers dully.
Mark
explain assimilatory nitrate reduction
Esinniobiwa Reply
Assimilatory nitrate reduction is a process that occurs in some microorganisms, such as bacteria and archaea, in which nitrate (NO3-) is reduced to nitrite (NO2-), and then further reduced to ammonia (NH3).
Elkana
This process is called assimilatory nitrate reduction because the nitrogen that is produced is incorporated in the cells of microorganisms where it can be used in the synthesis of amino acids and other nitrogen products
Elkana
Examples of thermophilic organisms
Shu Reply
Give Examples of thermophilic organisms
Shu
advantages of normal Flora to the host
Micheal Reply
Prevent foreign microbes to the host
Abubakar
they provide healthier benefits to their hosts
ayesha
They are friends to host only when Host immune system is strong and become enemies when the host immune system is weakened . very bad relationship!
Mark
what is cell
faisal Reply
cell is the smallest unit of life
Fauziya
cell is the smallest unit of life
Akanni
ok
Innocent
cell is the structural and functional unit of life
Hasan
is the fundamental units of Life
Musa
what are emergency diseases
Micheal Reply
There are nothing like emergency disease but there are some common medical emergency which can occur simultaneously like Bleeding,heart attack,Breathing difficulties,severe pain heart stock.Hope you will get my point .Have a nice day ❣️
_Adnan
define infection ,prevention and control
Innocent
I think infection prevention and control is the avoidance of all things we do that gives out break of infections and promotion of health practices that promote life
Lubega
Heyy Lubega hussein where are u from?
_Adnan
en français
Adama
which site have a normal flora
ESTHER Reply
Many sites of the body have it Skin Nasal cavity Oral cavity Gastro intestinal tract
Safaa
skin
Asiina
skin,Oral,Nasal,GIt
Sadik
How can Commensal can Bacteria change into pathogen?
Sadik
How can Commensal Bacteria change into pathogen?
Sadik
all
Tesfaye
by fussion
Asiina
what are the advantages of normal Flora to the host
Micheal
what are the ways of control and prevention of nosocomial infection in the hospital
Micheal
what is inflammation
Shelly Reply
part of a tissue or an organ being wounded or bruised.
Wilfred
what term is used to name and classify microorganisms?
Micheal Reply
Binomial nomenclature
adeolu
Got questions? Join the online conversation and get instant answers!
Jobilize.com Reply

Get Jobilize Job Search Mobile App in your pocket Now!

Get it on Google Play Download on the App Store Now


Source:  OpenStax, A brief introduction to engineering computation with matlab. OpenStax CNX. Nov 17, 2015 Download for free at http://legacy.cnx.org/content/col11371/1.11
Google Play and the Google Play logo are trademarks of Google Inc.

Notification Switch

Would you like to follow the 'A brief introduction to engineering computation with matlab' conversation and receive update notifications?

Ask