<< Chapter < Page Chapter >> Page >
This module describes how to graph absolute values.

You can graph y = x size 12{y= lline x rline } {} easily enough by plotting points. The characteristic V shape is illustrated below, with a couple of sample points highlighted.

Graph showing the absolute value of x.
y = | x |

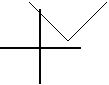
Of course, this shape is subject to the same permutations as any other function! A few examples are given below.

Graph of the absolute value of x+5, the same as above but shifted to the left 5 units (x+5).
| x - 5 | + 1 Moves right 5, up 1
Graph of the absolute value of -|x|+1, the same as first but vertically flipped and shifted up 1 unit.
- | x | + 1 Flips over x -axis, moves up 1
Graph of the absolute value of 2|x+5|, the same as first vertically stretched by a factor of 2 (skinnier).
2 | x + 5 | 5 left, vertically stretched

Get Jobilize Job Search Mobile App in your pocket Now!

Get it on Google Play Download on the App Store Now


Source:  OpenStax, Advanced algebra ii: conceptual explanations. OpenStax CNX. May 04, 2010 Download for free at http://cnx.org/content/col10624/1.15
Google Play and the Google Play logo are trademarks of Google Inc.

Notification Switch

Would you like to follow the 'Advanced algebra ii: conceptual explanations' conversation and receive update notifications?

Ask