<< Chapter < Page Chapter >> Page >

Bone markings

The surface features of bones vary considerably, depending on the function and location in the body. [link] describes the bone markings, which are illustrated in ( [link] ). There are three general classes of bone markings: (1) articulations, (2) projections, and (3) holes. As the name implies, an articulation    is where two bone surfaces come together (articulus = “joint”). These surfaces tend to conform to one another, such as one being rounded and the other cupped, to facilitate the function of the articulation. A projection    is an area of a bone that projects above the surface of the bone. These are the attachment points for tendons and ligaments. In general, their size and shape is an indication of the forces exerted through the attachment to the bone. A hole    is an opening or groove in the bone that allows blood vessels and nerves to enter the bone. As with the other markings, their size and shape reflect the size of the vessels and nerves that penetrate the bone at these points.

Bone Markings
Marking Description Example
Articulations Where two bones meet Knee joint
Head Prominent rounded surface Head of femur
Facet Flat surface Vertebrae
Condyle Rounded surface Occipital condyles
Projections Raised markings Spinous process of the vertebrae
Protuberance Protruding Chin
Process Prominence feature Transverse process of vertebra
Spine Sharp process Ischial spine
Tubercle Small, rounded process Tubercle of humerus
Tuberosity Rough surface Deltoid tuberosity
Line Slight, elongated ridge Temporal lines of the parietal bones
Crest Ridge Iliac crest
Holes Holes and depressions Foramen (holes through which blood vessels can pass through)
Fossa Elongated basin Mandibular fossa
Fovea Small pit Fovea capitis on the head of the femur
Sulcus Groove Sigmoid sulcus of the temporal bones
Canal Passage in bone Auditory canal
Fissure Slit through bone Auricular fissure
Foramen Hole through bone Foramen magnum in the occipital bone
Meatus Opening into canal External auditory meatus
Sinus Air-filled space in bone Nasal sinus

Bone features

This illustration contains three diagrams. The left diagram is titled examples of processes formed where tendons or ligaments attach. The image shows an anterior view of the femur and an anterior view of the humerus. For the femur, the distal epiphysis contains a smaller lateral bulge and a larger medial bulge. These are examples of condyles. The inner halves of the two condyles as well as the groove between them compose a facet. An oval-shaped ridge on the medial surface of the distal metaphysis is an example of a tubercle. On the proximal epiphysis of the femur, the large knob that attaches to the hip socket is an example of a head. The tip of the head contains a small depression, an example of a fovea called the fovea capitis. On the humerus, the distal epiphysis contains a central depression that is an example of a fossa. Two condyles are located on the right and left sides of the fossa. The diaphysis of the humerus contains a small ridge running up the shaft that is an example of a tuberosity. The proximal epiphysis of the humerus contains a lateral and a medial bulge that are both examples of tubercles. Finally, a narrow groove runs from the center of the proximal metaphysis in between the medial and lateral condyles. This is an example of a sulcus. The middle image is entitled elevations or depressions. It shows an anterior view of the hip bones. The hip bones are shaped like two wings that join at the bottom. The crest along the upper edge of each hip bones, at the tip of each “wing” is an example of an elevation. A depression on the inner surface of both hip bones just under the crest is called out as a fossa. The right image is entitled examples of openings and shows an anterior view of the skull. The bone underlying the chin is an example of a protuberance while two small holes above each eye socket are examples of foramen. Five green sinuses surround the nose cavity are colored green. These are sinuses because they are hollowed out cavities within the skull bones. A small channel leads into the corner of each eye where the tear ducts occur. These two channels are both examples of a canal. Finally, the bones that form the posterior wall of the eye socket have a small crack running diagonally away from the nose. These are examples of fissures.
The surface features of bones depend on their function, location, attachment of ligaments and tendons, or the penetration of blood vessels and nerves.

Bone cells and tissue

Bone contains a relatively small number of cells entrenched in a matrix of collagen fibers that provide a surface for inorganic salt crystals to adhere. These salt crystals form when calcium phosphate and calcium carbonate combine to create hydroxyapatite, which incorporates other inorganic salts like magnesium hydroxide, fluoride, and sulfate as it crystallizes, or calcifies, on the collagen fibers. The hydroxyapatite crystals give bones their hardness and strength, while the collagen fibers give them flexibility so that they are not brittle.

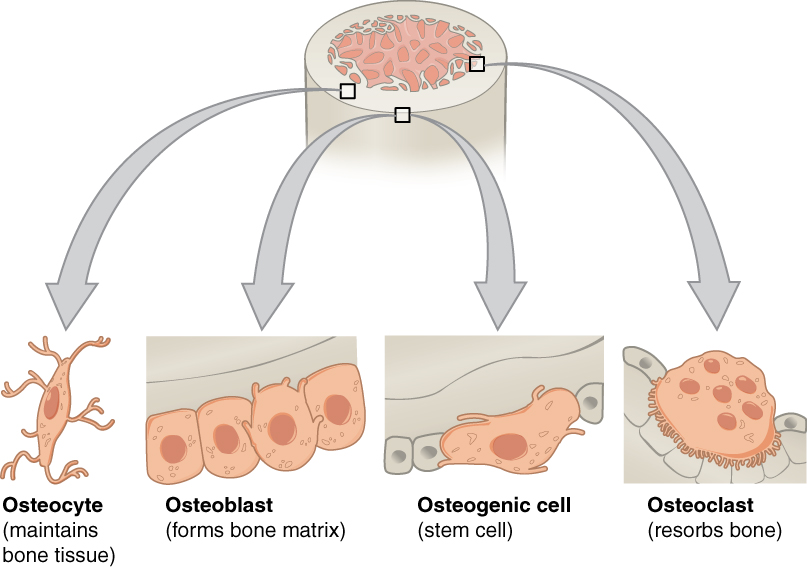
Although bone cells compose a small amount of the bone volume, they are crucial to the function of bones. Four types of cells are found within bone tissue: osteoblasts, osteocytes, osteogenic cells, and osteoclasts ( [link] ).

Bone cells

The top of this diagram shows the cross section of a generic bone with three zoom in boxes. The first box is on the periosteum. The second box is on the middle of the compact bone layer. The third box is on the inner edge of the compact bone where it transitions into the spongy bone. The callout in the periosteum points to two images. In the first image, four osteoblast cells are sitting end to end on the periosteum. The osteoblasts are roughly square shaped, except for one of the cells which is developing small, finger like projections. The caption says, “Osteoblasts form the matrix of the bone.” The second image called out from the periosteum shows a large, amorphous osteogenic cell sitting on the periosteum. The osteogenic cell is surrounded on both sides by a row of much smaller osteoblasts. The cell is shaped like a mushroom cap and also has finger like projections. The cell is a stem cell that develops into other bone cells. The box in the middle of the compact bone layer is pointing to an osteocyte. The osteocyte is a thin cell, roughly diamond shaped, with many branching, finger-like projections. The osteoctyes maintain bone tissue. The box at the inner edge of the compact bone is pointing to an osteoclast. The osteoclast is a large, round cell with multiple nuclei. It also has rows of fine finger like projections on its lower surface where it is sitting on the compact bone. The osteoclast reabsorbs bone.
Four types of cells are found within bone tissue. Osteogenic cells are undifferentiated and develop into osteoblasts. When osteoblasts get trapped within the calcified matrix, their structure and function changes, and they become osteocytes. Osteoclasts develop from monocytes and macrophages and differ in appearance from other bone cells.

Questions & Answers

differentiate between demand and supply giving examples
Lambiv Reply
differentiated between demand and supply using examples
Lambiv
what is labour ?
Lambiv
how will I do?
Venny Reply
how is the graph works?I don't fully understand
Rezat Reply
information
Eliyee
devaluation
Eliyee
t
WARKISA
hi guys good evening to all
Lambiv
multiple choice question
Aster Reply
appreciation
Eliyee
explain perfect market
Lindiwe Reply
In economics, a perfect market refers to a theoretical construct where all participants have perfect information, goods are homogenous, there are no barriers to entry or exit, and prices are determined solely by supply and demand. It's an idealized model used for analysis,
Ezea
What is ceteris paribus?
Shukri Reply
other things being equal
AI-Robot
When MP₁ becomes negative, TP start to decline. Extuples Suppose that the short-run production function of certain cut-flower firm is given by: Q=4KL-0.6K2 - 0.112 • Where is quantity of cut flower produced, I is labour input and K is fixed capital input (K-5). Determine the average product of lab
Kelo
Extuples Suppose that the short-run production function of certain cut-flower firm is given by: Q=4KL-0.6K2 - 0.112 • Where is quantity of cut flower produced, I is labour input and K is fixed capital input (K-5). Determine the average product of labour (APL) and marginal product of labour (MPL)
Kelo
yes,thank you
Shukri
Can I ask you other question?
Shukri
what is monopoly mean?
Habtamu Reply
What is different between quantity demand and demand?
Shukri Reply
Quantity demanded refers to the specific amount of a good or service that consumers are willing and able to purchase at a give price and within a specific time period. Demand, on the other hand, is a broader concept that encompasses the entire relationship between price and quantity demanded
Ezea
ok
Shukri
how do you save a country economic situation when it's falling apart
Lilia Reply
what is the difference between economic growth and development
Fiker Reply
Economic growth as an increase in the production and consumption of goods and services within an economy.but Economic development as a broader concept that encompasses not only economic growth but also social & human well being.
Shukri
production function means
Jabir
What do you think is more important to focus on when considering inequality ?
Abdisa Reply
any question about economics?
Awais Reply
sir...I just want to ask one question... Define the term contract curve? if you are free please help me to find this answer 🙏
Asui
it is a curve that we get after connecting the pareto optimal combinations of two consumers after their mutually beneficial trade offs
Awais
thank you so much 👍 sir
Asui
In economics, the contract curve refers to the set of points in an Edgeworth box diagram where both parties involved in a trade cannot be made better off without making one of them worse off. It represents the Pareto efficient allocations of goods between two individuals or entities, where neither p
Cornelius
In economics, the contract curve refers to the set of points in an Edgeworth box diagram where both parties involved in a trade cannot be made better off without making one of them worse off. It represents the Pareto efficient allocations of goods between two individuals or entities,
Cornelius
Suppose a consumer consuming two commodities X and Y has The following utility function u=X0.4 Y0.6. If the price of the X and Y are 2 and 3 respectively and income Constraint is birr 50. A,Calculate quantities of x and y which maximize utility. B,Calculate value of Lagrange multiplier. C,Calculate quantities of X and Y consumed with a given price. D,alculate optimum level of output .
Feyisa Reply
Answer
Feyisa
c
Jabir
the market for lemon has 10 potential consumers, each having an individual demand curve p=101-10Qi, where p is price in dollar's per cup and Qi is the number of cups demanded per week by the i th consumer.Find the market demand curve using algebra. Draw an individual demand curve and the market dema
Gsbwnw Reply
suppose the production function is given by ( L, K)=L¼K¾.assuming capital is fixed find APL and MPL. consider the following short run production function:Q=6L²-0.4L³ a) find the value of L that maximizes output b)find the value of L that maximizes marginal product
Abdureman
types of unemployment
Yomi Reply
What is the difference between perfect competition and monopolistic competition?
Mohammed
Got questions? Join the online conversation and get instant answers!
Jobilize.com Reply

Get Jobilize Job Search Mobile App in your pocket Now!

Get it on Google Play Download on the App Store Now


Source:  OpenStax, Anatomy & Physiology: support and movement. OpenStax CNX. Aug 21, 2014 Download for free at https://legacy.cnx.org/content/col11700/1.1
Google Play and the Google Play logo are trademarks of Google Inc.

Notification Switch

Would you like to follow the 'Anatomy & Physiology: support and movement' conversation and receive update notifications?

Ask