Om die struktuur van sommige regte prismas te verstaan
[LU 3.3, 3.4]
A.
Bou houers
Daar sal aan jou ‘n vel papier met vorms gegee word. Jy benodig ‘n liniaal waarmee jy kan meet, ‘n skêr en gom of kleefband. Kleurpotlode sal ook help. Doen die volgende:
Meet al die lyne en skryf jou mate netjies neer (jy behoort tot die naaste half-millimeter te kan meet). Doen ook jou bes om die deursnee (of die radius) van die sirkel te meet. As jy ‘n gradeboog beskikbaar het, bepaal ook waar die 90° hoeke is.
Bepaal nou die oppervlaktes van al die vorms vanuit jou mates. Tel die verskillend dele bymekaar om die totale oppervlaktes van die vier verskillende vorms te bereken. Sit jou werk versigtig uiteen sodat enigeen kan begryp wat jy doen. Gebruik die regte name vir die vorms waarmee jy werk.
Byvoorbeeld, vir die laaste figuur sou dit so lyk:
Totale oppervlakte = klein reghoek + klein reghoek + groot reghoek
= (l × b) + (l × b) + (l × b)
ensovoorts . . . (Onthou om altyd geskikte eenhede te gebruik.)
Sny nou die vorms versigtig uit. Jy kan hulle inkleur as dit jou sou help om die bokant en onderkant van die sykante (met die strepe) te onderskei. Vou die vorms nou en gebruik kleefband of gom en papierstrokies om vier houertjies te maak. Hou die kante met die strepe aan die buitekant.
Skryf die
Totale Buite-Oppervlakte (TBO) van elke vorm neer. (Dis wat jy reeds bereken het!)
Werk saam in groepies van drie of vier en probeer uitwerk hoeveel 1cm × 1cm blokkies in elk van die houers sou inpas. Hierdie waarde is
volume van die houer. As julle ‘n metode of formule kan vind wat vir elkeen van die vorms sou werk, skryf dit sorgvuldig neer.
As jy klaar is met hierdie oefening behoort jy twee formules te hê.
B.
Regte prismas
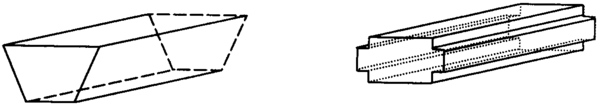
Hierdie vier houers is elk ‘n
regte prisma . Hierdie vorms het ‘n basis en ‘n bokant wat presies dieselfde grootte en vorm het, met sye wat reguit boontoe loop en ‘n 90° hoek vorm met die basis. Soek vir jou items wat aan hierdie vereistes voldoen en dus regte prismas is.
Ons benoem regte prismas volgens die vorm van die basis, byvoorbeeld vierkantige prisma, reghoekige prisma, driehoekige prisma en sirkelvormige prisma (silinder).
Is hierdie twee vorms regte prismas? Beskryf die vorm van elkeen se basis en bevestig of die sye regop loop teen 90° met die basis.
C.
Formules
Om die totale buite-oppervlakte (TBO) en volume (V) van enige regte prisma te bereken, gebruik ons die volgende algemene formules: (Let op dat H na die prisma se hoogte verwys.)
TBO = 2 × basisoppervlakte + sy-oppervlakte en V = basisoppervlakte × prismahoogte
Die volgende voorbeelde is belangrik. Dit is die vier houers wat jy uitgesny en gevou het. Let op dat elke afdeling van die berekening apart gedoen word en dan uiteindelik in die formule ingestel word.
In economics, a perfect market refers to a theoretical construct where all participants have perfect information, goods are homogenous, there are no barriers to entry or exit, and prices are determined solely by supply and demand. It's an idealized model used for analysis,
When MP₁ becomes negative, TP start to decline.
Extuples Suppose that the short-run production function of certain cut-flower firm is given by: Q=4KL-0.6K2 - 0.112 •
Where is quantity of cut flower produced, I is labour input and K is fixed capital input (K-5). Determine the average product of lab
Kelo
Extuples Suppose that the short-run production function of certain cut-flower firm is given by: Q=4KL-0.6K2 - 0.112 •
Where is quantity of cut flower produced, I is labour input and K is fixed capital input (K-5). Determine the average product of labour (APL) and marginal product of labour (MPL)
Quantity demanded refers to the specific amount of a good or service that consumers are willing and able to purchase at a give price and within a specific time period. Demand, on the other hand, is a broader concept that encompasses the entire relationship between price and quantity demanded
Ezea
ok
Shukri
how do you save a country economic situation when it's falling apart
Economic growth as an increase in the production and consumption of goods and services within an economy.but
Economic development as a broader concept that encompasses not only economic growth but also social & human well being.
Shukri
production function means
Jabir
What do you think is more important to focus on when considering inequality ?
sir...I just want to ask one question... Define the term contract curve? if you are free please help me to find this answer 🙏
Asui
it is a curve that we get after connecting the pareto optimal combinations of two consumers after their mutually beneficial trade offs
Awais
thank you so much 👍 sir
Asui
In economics, the contract curve refers to the set of points in an Edgeworth box diagram where both parties involved in a trade cannot be made better off without making one of them worse off. It represents the Pareto efficient allocations of goods between two individuals or entities, where neither p
Cornelius
In economics, the contract curve refers to the set of points in an Edgeworth box diagram where both parties involved in a trade cannot be made better off without making one of them worse off. It represents the Pareto efficient allocations of goods between two individuals or entities,
Cornelius
Suppose a consumer consuming two commodities X and Y has
The following utility function u=X0.4 Y0.6. If the price of the X and Y are 2 and 3 respectively and income Constraint is birr 50.
A,Calculate quantities of x and y which maximize utility.
B,Calculate value of Lagrange multiplier.
C,Calculate quantities of X and Y consumed with a given price.
D,alculate optimum level of output .
the market for lemon has 10 potential consumers, each having an individual demand curve p=101-10Qi, where p is price in dollar's per cup and Qi is the number of cups demanded per week by the i th consumer.Find the market demand curve using algebra. Draw an individual demand curve and the market dema
suppose the production function is given by ( L, K)=L¼K¾.assuming capital is fixed find APL and MPL. consider the following short run production function:Q=6L²-0.4L³ a) find the value of L that maximizes output b)find the value of L that maximizes marginal product