<< Chapter < Page Chapter >> Page >

By the end of this section, you will be able to:

  • Interpret production possibilities frontier graphs
  • Contrast a budget constraint and a production possibilities frontier
  • Explain the relationship between a production possibilities frontier and the law of diminishing returns
  • Contrast productive efficiency and allocative efficiency
  • Define comparative advantage

Just as individuals cannot have everything they want and must instead make choices, society as a whole cannot have everything it might want, either. This section of the chapter will explain the constraints faced by society, using a model called the production possibilities frontier (PPF)    . There are more similarities than differences between individual choice and social choice. As you read this section, focus on the similarities.

Because society has limited resources (e.g., labor, land, capital, raw materials) at any point in time, there is a limit to the quantities of goods and services it can produce. Suppose a society desires two products, healthcare and education. This situation is illustrated by the production possibilities frontier in [link] .

A healthcare vs. education production possibilities frontier

 The graph shows that a society has limited resources and often must prioritize where to invest. On this graph, the y-axis is ʺHealthcare,ʺ and the x-axis is ʺEducation.ʺ
This production possibilities frontier shows a tradeoff between devoting social resources to healthcare and devoting them to education. At A all resources go to healthcare and at B, most go to healthcare. At D most resources go to education, and at F, all go to education.

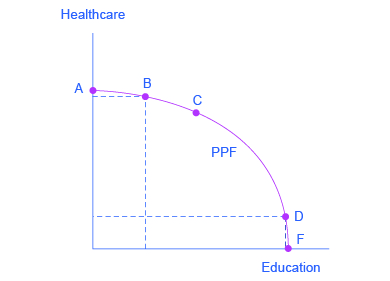
In [link] , healthcare is shown on the vertical axis and education is shown on the horizontal axis. If the society were to allocate all of its resources to healthcare, it could produce at point A. But it would not have any resources to produce education. If it were to allocate all of its resources to education, it could produce at point F. Alternatively, the society could choose to produce any combination of healthcare and education shown on the production possibilities frontier. In effect, the production possibilities frontier plays the same role for society as the budget constraint plays for Alphonso. Society can choose any combination of the two goods on or inside the PPF. But it does not have enough resources to produce outside the PPF.

Most important, the production possibilities frontier clearly shows the tradeoff between healthcare and education. Suppose society has chosen to operate at point B, and it is considering producing more education. Because the PPF is downward sloping from left to right, the only way society can obtain more education is by giving up some healthcare. That is the tradeoff society faces. Suppose it considers moving from point B to point C. What would the opportunity cost be for the additional education? The opportunity cost would be the healthcare society has to give up. Just as with Alphonso’s budget constraint, the opportunity cost is shown by the slope of the production possibilities frontier. By now you might be saying, “Hey, this PPF is sounding like the budget constraint.” If so, read the following Clear It Up feature.

Questions & Answers

how do you get the 2/50
Abba Reply
number of sport play by 50 student construct discrete data
Aminu Reply
width of the frangebany leaves on how to write a introduction
Theresa Reply
Solve the mean of variance
Veronica Reply
Step 1: Find the mean. To find the mean, add up all the scores, then divide them by the number of scores. ... Step 2: Find each score's deviation from the mean. ... Step 3: Square each deviation from the mean. ... Step 4: Find the sum of squares. ... Step 5: Divide the sum of squares by n – 1 or N.
kenneth
what is error
Yakuba Reply
Is mistake done to something
Vutshila
Hy
anas
hy
What is the life teble
anas
hy
Jibrin
statistics is the analyzing of data
Tajudeen Reply
what is statics?
Zelalem Reply
how do you calculate mean
Gloria Reply
diveving the sum if all values
Shaynaynay
let A1,A2 and A3 events be independent,show that (A1)^c, (A2)^c and (A3)^c are independent?
Fisaye Reply
what is statistics
Akhisani Reply
data collected all over the world
Shaynaynay
construct a less than and more than table
Imad Reply
The sample of 16 students is taken. The average age in the sample was 22 years with astandard deviation of 6 years. Construct a 95% confidence interval for the age of the population.
Aschalew Reply
Bhartdarshan' is an internet-based travel agency wherein customer can see videos of the cities they plant to visit. The number of hits daily is a normally distributed random variable with a mean of 10,000 and a standard deviation of 2,400 a. what is the probability of getting more than 12,000 hits? b. what is the probability of getting fewer than 9,000 hits?
Akshay Reply
Bhartdarshan'is an internet-based travel agency wherein customer can see videos of the cities they plan to visit. The number of hits daily is a normally distributed random variable with a mean of 10,000 and a standard deviation of 2,400. a. What is the probability of getting more than 12,000 hits
Akshay
1
Bright
Sorry i want to learn more about this question
Bright
Someone help
Bright
a= 0.20233 b=0.3384
Sufiyan
a
Shaynaynay
How do I interpret level of significance?
Mohd Reply
It depends on your business problem or in Machine Learning you could use ROC- AUC cruve to decide the threshold value
Shivam
how skewness and kurtosis are used in statistics
Owen Reply
yes what is it
Taneeya
Got questions? Join the online conversation and get instant answers!
Jobilize.com Reply

Get Jobilize Job Search Mobile App in your pocket Now!

Get it on Google Play Download on the App Store Now


Source:  OpenStax, Principles of economics. OpenStax CNX. Sep 19, 2014 Download for free at http://legacy.cnx.org/content/col11613/1.11
Google Play and the Google Play logo are trademarks of Google Inc.

Notification Switch

Would you like to follow the 'Principles of economics' conversation and receive update notifications?

Ask