

| << Chapter < Page | Chapter >> Page > |
An elementary school class ran 1 mile with a mean of 11 minutes and a standard deviation of 3 minutes. Rachel, a student in the class, ran 1 mile in 8 minutes. A junior high school class ran 1 mile with a mean of 9 minutes and a standard deviation of 2 minutes. Kenji, a student in the class, ran 1 mile in 8.5 minutes. A high school class ran 1 mile with a mean of 7 minutes and a standard deviation of 4 minutes. Nedda, a student in the class, ran 1 mile in 8 minutes.
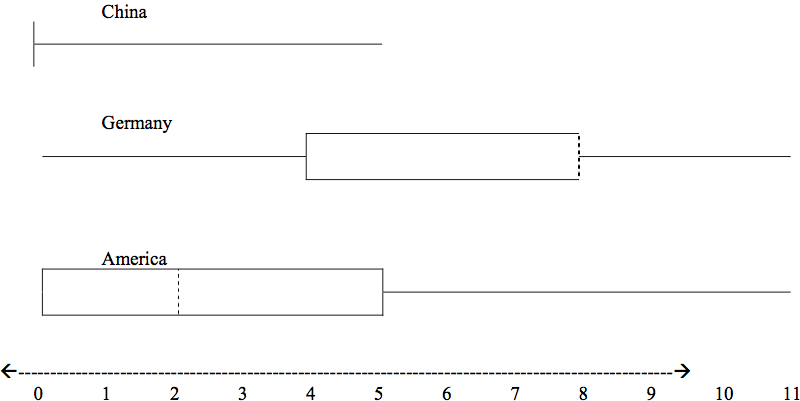
In a survey of 20 year olds in China, Germany and America, people were asked the number of foreign countries they had visited in their lifetime. The following box plots display the results.
One hundred teachers attended a seminar on mathematical problem solving. The attitudes of a representative sample of 12 of the teachers were measured before and after the seminar. A positive number for change in attitude indicates that a teacher's attitude toward math became more positive. The twelve change scores are as follows:
Three students were applying to the same graduate school. They came from schools with different grading systems. Which student had the best G.P.A. when compared to his school? Explain how you determined your answer.
| Student | G.P.A. | School Ave. G.P.A. | School Standard Deviation |
|---|---|---|---|
| Thuy | 2.7 | 3.2 | 0.8 |
| Vichet | 87 | 75 | 20 |
| Kamala | 8.6 | 8 | 0.4 |
Kamala
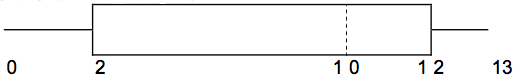
Given the following box plot:
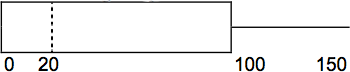
Given the following box plot:
Santa Clara County, CA, has approximately 27,873 Japanese-Americans. Their ages are as follows. ( Source: West magazine )
| Age Group | Percent of Community |
|---|---|
| 0-17 | 18.9 |
| 18-24 | 8.0 |
| 25-34 | 22.8 |
| 35-44 | 15.0 |
| 45-54 | 13.1 |
| 55-64 | 11.9 |
| 65+ | 10.3 |
Notification Switch
Would you like to follow the 'Collaborative statistics for mt230' conversation and receive update notifications?

|
|

|
|

|
|

|
|

|
|

|
|

|
|

|
|

|
|

|