

| << Chapter < Page | Chapter >> Page > |
Now, let’s look at what happens with protectionism . U.S. sugar farmers are likely to argue that, if only they could be protected from sugar imported from Brazil, the United States would have higher domestic sugar production, more jobs in the sugar industry, and American sugar farmers would receive a higher price. If the United States government sets a high-enough tariff on imported sugar, or sets an import quota at zero, the result will be that the quantity of sugar traded between countries could be reduced to zero, and the prices in each country will return to the levels before trade was allowed.
Blocking only some trade is also possible. Suppose that the United States passed a sugar import quota of seven tons. The United States will import no more than seven tons of sugar, which means that Brazil can export no more than seven tons of sugar to the United States. As a result, the price of sugar in the United States will be 20 cents, which is the price where the quantity demanded is seven tons greater than the domestic quantity supplied. Conversely, if Brazil can export only seven tons of sugar, then the price of sugar in Brazil will be 14 cents per pound, which is the price where the domestic quantity supplied in Brazil is seven tons greater than domestic demand.
In general, when a country sets a low or medium tariff or import quota, the equilibrium price and quantity will be somewhere between no trade and completely free trade. The following Work It Out explores the impact of these trade barriers.
Let’s look carefully at the effects of tariffs or quotas. If the U.S. government imposes a tariff or quota sufficient to eliminate trade with Brazil, two things occur: U.S. consumers pay a higher price and therefore buy a smaller quantity of sugar. U.S. producers obtain a higher price so they sell a larger quantity of sugar. The effects of a tariff on producers and consumers in the United States can be measured using two concepts developed in Demand, Supply, and Efficiency : consumer surplus and producer surplus .
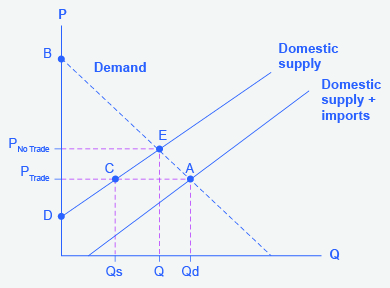
Step 1. Look at [link] , which shows a hypothetical version of the demand and supply of sugar in the United States.
Step 2. Note that the sugar market is in equilibrium at point A where Domestic Quantity Demanded (Qd) = Quantity Supplied (Domestic Qs + Imports from Brazil) at a price of P Trade when there is free trade.
Step 3. Note, also, that imports are equal to the distance between points C and A.
Step 4. Recall that consumer surplus is the value a consumer gets beyond what they paid for when they buy a product. Graphically, it is the area under a demand curve but above the price. In this case, the consumer surplus in the United States is the area of the triangle formed by the points P Trade , A, and B.
Step 5. Recall, also, that producer surplus is another name for profit—it is the income producers get above the cost of production, which is shown by the supply curve here. In this case, the producer surplus with trade is the area of the triangle formed by the points P trade , C, and D.
Step 6. Suppose that the barriers to trade are imposed, imports are excluded, and the price rises to P NoTrade . Look what happens to producer surplus and consumer surplus. At the higher price, the domestic quantity supplied increases from Qs to Q at point E. Because producers are selling more quantity at a higher price, the producer surplus increases to the area of the triangle P NoTrade , E, and D.
Step 7. Compare the areas of the two triangles and you will see the increase in the producer surplus.
Step 8. Examine the consumer surplus. Consumers are now paying a higher price to get a lower quantity (Q instead of Qd). Their consumer surplus shrinks to the area of the triangle P NoTrade , E, and B.
Step 9. Determine the net effect. The producer surplus increases by the area P trade , C, E, P NoTrade . The loss of consumer surplus, however, is larger. It is the area P trade , A, E, P NoTrade . In other words, consumers lose more than producers gain as a result of the trade barriers and the United States has a lower social surplus.
Notification Switch
Would you like to follow the 'Principles of macroeconomics' conversation and receive update notifications?

|
|
|
|
|

|
|

|
|

|
|

|
|

|
|

|
|

|
|
|
|