

| << Chapter < Page | Chapter >> Page > |
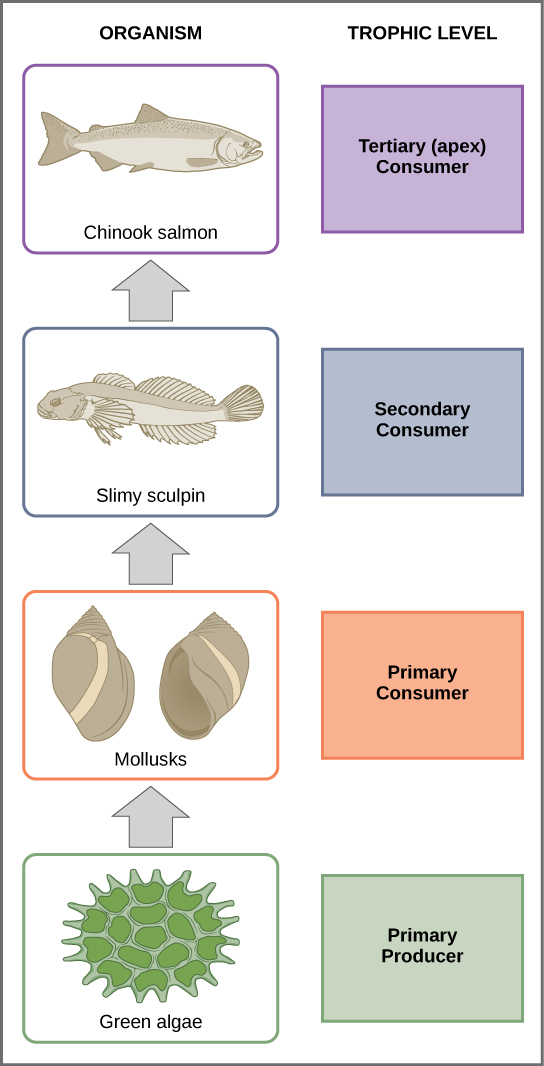
In many ecosystems, the bottom of the food chain consists of photosynthetic organisms (plants and/or phytoplankton), which are called primary producers . The organisms that consume the primary producers are herbivores: the primary consumers . Secondary consumers are usually carnivores that eat the primary consumers. Tertiary consumers are carnivores that eat other carnivores. Higher-level consumers feed on the next lower tropic levels, and so on, up to the organisms at the top of the food chain: the apex consumers . In the Lake Ontario food chain shown in [link] , the Chinook salmon is the apex consumer at the top of this food chain.
One major factor that limits the length of food chains is energy. Energy is lost as heat between each trophic level due to the second law of thermodynamics. Thus, after a limited number of trophic energy transfers, the amount of energy remaining in the food chain may not be great enough to support viable populations at yet a higher trophic level.
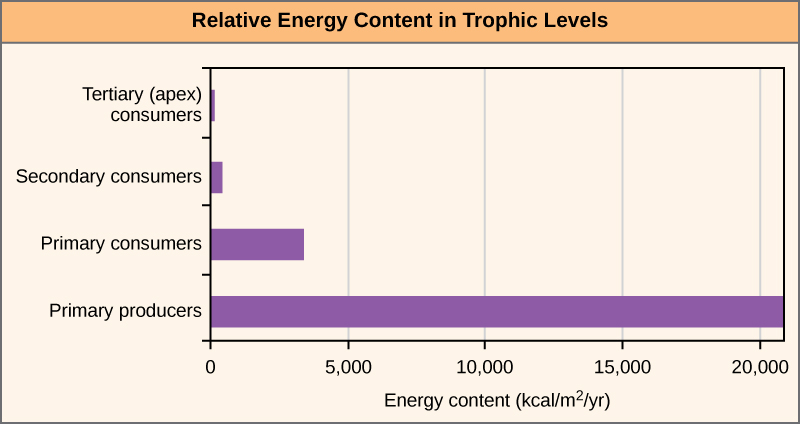
The loss of energy between trophic levels is illustrated by the pioneering studies of Howard T. Odum in the Silver Springs, Florida, ecosystem in the 1940s ( [link] ). The primary producers generated 20,819 kcal/m 2 /yr (kilocalories per square meter per year), the primary consumers generated 3368 kcal/m 2 /yr, the secondary consumers generated 383 kcal/m 2 /yr, and the tertiary consumers only generated 21 kcal/m 2 /yr. Thus, there is little energy remaining for another level of consumers in this ecosystem.
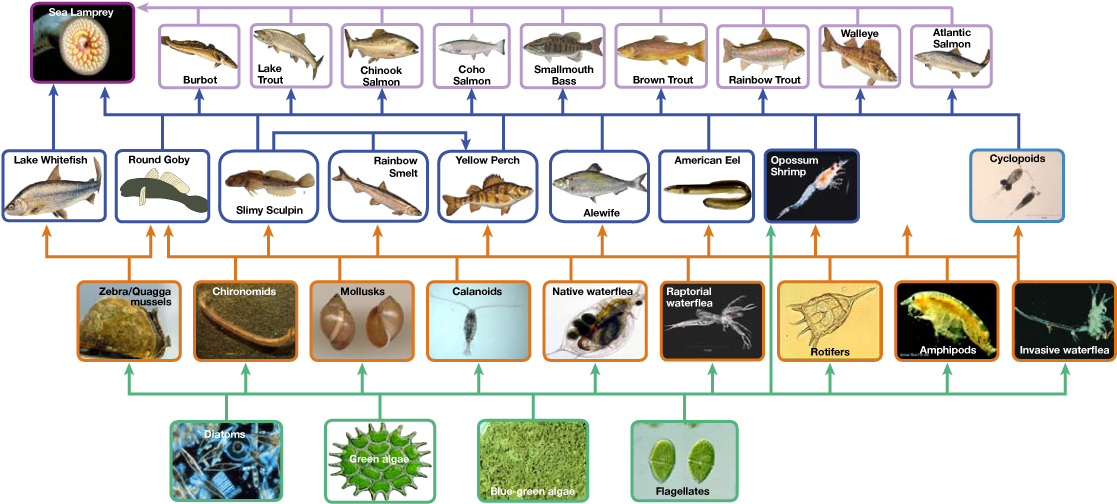
There is a one problem when using food chains to accurately describe most ecosystems. Even when all organisms are grouped into appropriate trophic levels, some of these organisms can feed on species from more than one trophic level; likewise, some of these organisms can be eaten by species from multiple trophic levels. In other words, the linear model of ecosystems, the food chain, is not completely descriptive of ecosystem structure. A holistic model—which accounts for all the interactions between different species and their complex interconnected relationships with each other and with the environment—is a more accurate and descriptive model for ecosystems. A food web is a graphic representation of a holistic, non-linear web of primary producers, primary consumers, and higher-level consumers used to describe ecosystem structure and dynamics ( [link] ).
Notification Switch
Would you like to follow the 'University of georgia biology' conversation and receive update notifications?

|
|

|
|

|
|

|
|

|
|

|
|

|
|

|
|

|
|

|