

| << Chapter < Page | Chapter >> Page > |
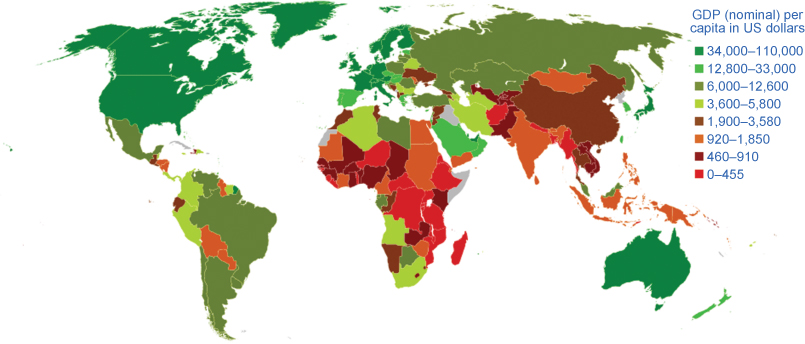
An overview of the regional averages of GDP per person for developing countries, measured in comparable international dollars as well as population in 2008 ( [link] ), shows that the differences across these regions are stark. As [link] shows, nominal GDP per capita in 2012 for the 581.4 million people living in Latin America and the Caribbean region was $9,190, which far exceeds that of South Asia and sub-Saharan Africa. In turn, people in the high-income nations of the world, such as those who live in the European Union nations or North America, have a per capita GDP three to four times that of the people of Latin America. To put things in perspective, North America and the European Union have slightly more than 9% of the world’s population, but they produce and consume close to 70% of the world’s GDP.
| Population (in millions) | GDP Per Capita | |
|---|---|---|
| East Asia and Pacific | 2,006 | $5,536 |
| South Asia | 1,671 | $1,482 |
| Sub-Saharan Africa | 936.1 | $1,657 |
| Latin America and Caribbean | 588 | $9,536 |
| Middle East and North Africa | 345.4 | $3,456 |
| Europe and Central Asia | 272.2 | $7,118 |
Such comparisons between regions are admittedly rough. After all, per capita GDP cannot fully capture the quality of life. Many other factors have a large impact on the standard of living, like health, education, human rights, crime and personal safety, and environmental quality. These measures also reveal very wide differences in the standard of living across the regions of the world. Much of this is correlated with per capita income, but there are exceptions. For example, life expectancy at birth in many low-income regions approximates those who are more affluent. The data also illustrate that nobody can claim to have perfect standards of living . For instance, despite very high income levels, there is still undernourishment in Europe and North America.
Economists know that there are many factors that contribute to your standard of living. People in high-income countries may have very little time due to heavy workloads and may feel disconnected from their community. Lower-income countries may be more community centered, but have little in the way of material wealth. It is hard to measure these characteristics of standard of living. The Organization for Economic Co-Operation and Development has developed the “OECD Better Life Index.” Visit this website to see how countries measure up to your expected standard of living.
The differences in economic statistics and other measures of well-being, substantial though they are, do not fully capture the reasons for the enormous differences between countries. Aside from the neoclassical determinants of growth , four additional determinants are significant in a wide range of statistical studies and are worth mentioning: geography, demography, industrial structure, and institutions.
Notification Switch
Would you like to follow the 'Principles of macroeconomics' conversation and receive update notifications?

|
|

|
|
|
|
|

|
|

|
|

|
|

|
|
|
|
|

|
|

|