

| << Chapter < Page | Chapter >> Page > |
Investors can also put money into other tangible assets such as gold, silver, and other precious metals, or in duller commodities like sugar, cocoa, coffee, orange juice, oil, and natural gas. The return on these investments derives from the saver’s hope of buying low, selling high, and receiving a capital gain. Investing in, say, gold or coffee offers relatively little in the way of nonfinancial benefits to the user (unless the investor likes to caress gold or gaze upon a warehouse full of coffee). Indeed, typically investors in these commodities never even see the physical goods; instead, they sign a contract that takes ownership of a certain quantity of these commodities, which are stored in a warehouse, and later they sell the ownership to someone else. As one example, from 1981 to 2005, the price of gold generally fluctuated between about $300 and $500 per ounce, but then rose sharply to over $1,100 per ounce by early 2010.
A final area of tangible assets are “collectibles” like paintings, fine wine, jewelry, antiques, or even baseball cards. Most collectibles provide returns both in the form of services or of a potentially higher selling price in the future. You can use paintings by hanging them on the wall; jewelry by wearing it; baseball cards by displaying them. You can also hope to sell them someday for more than you paid for them. However, the evidence on prices of collectibles, while scanty, is that while they may go through periods where prices skyrocket for a time, you should not expect to make a higher-than-average rate of return over a sustained period of time from investing in this way.
The bottom line on investing in tangible assets: rate of return—moderate, especially if you can receive nonfinancial benefits from, for example, living in the house; risk—moderate for housing or high if you buy gold or baseball cards; liquidity—low, because it often takes considerable time and energy to sell a house or a piece of fine art and turn your capital gain into cash. The next Clear It Up feature explains the issues in the recent U.S. housing market crisis.
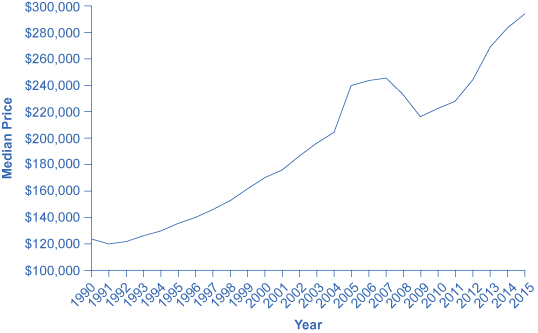
The cumulative average growth rate in housing prices from 1981 to 2000 was 5.1%. The price of an average U.S. home then took off from 2003 to 2005, rising at more than 10% per year. No serious analyst believed this rate of growth was sustainable; after all, if housing prices grew at, say, 11% per year over time, the average price of a home would more than double every seven years. However, at the time many serious analysts saw no reason for deep concern. After all, housing prices often change in fits and starts, like all prices, and a price surge for a few years is often followed by prices that are flat or even declining a bit as local markets adjust.
The sharp rise in housing prices was driven by a high level of demand for housing. Interest rates were low, so people were encouraged to borrow money to buy a house. Banks became much more flexible in their lending, making what were called “subprime” loans. Banks loaned money with low, or sometimes no, down payment. They offered loans with very low payments for the first two years, but then much higher payments after that; the idea was that housing prices would keep rising, so the borrower would just refinance the mortgage two years in the future, and thus would not ever have to make the higher payments. Some banks even offered so-called NINJA loans, which meant a loan given even though the borrower had No Income, No Job or Assets.
In retrospect, these loans seem nearly crazy. Many borrowers figured, however, that as long as housing prices kept rising, it made sense to buy. Many lenders used a process called “securitizing,” in which they sold their mortgages to financial companies, which put all the mortgages into a big pool, creating large financial securities, and then re-sold these mortgage-backed securities to investors. In this way, the lenders off-loaded the risks of the mortgages to investors. Investors were interested in mortgage-backed securities as they appeared to offer a steady stream of income, provided the mortgages were repaid. Investors relied on the ratings agencies to assess the credit risk associated with the mortgage backed securities. In hindsight, it appears that the credit agencies were far too lenient in their ratings of many of the securitized loans. Bank and financial regulators watched the steady rise in the market for mortgage-backed securities, but saw no reason at the time to intervene.
When housing prices turned down, many households that had borrowed when prices were high found that what they owed the bank was more than their home was worth. Many banks believed that they had diversified by selling their individual loans and instead buying securities based on mortgage loans from all over the country. After all, banks thought back in 2005, the average price of a house had not declined at any time since the Great Depression of the 1930s. These securities based on mortgage loans, however, turned out to be far riskier than expected. The bust in housing prices weakened the finances of both banks and households, and thus helped bring on the Great Recession of 2008–2009.
Notification Switch
Would you like to follow the 'University of houston downtown: microeconomics' conversation and receive update notifications?

|
|

|
|

|
|

|
|

|
|

|
|

|
|
|
|
|
|
|
|

|