

| << Chapter < Page | Chapter >> Page > |
| Measure of the Stock Market | Comments |
|---|---|
| Dow Jones Industrial Average (DJIA): http://indexes.dowjones.com | Based on 30 large companies from a diverse set of representative industries, chosen by analysts at Dow Jones and Company. The index was started in 1896. |
| Standard&Poor’s 500: http://www.standardandpoors.com | Based on 500 large U.S. firms, chosen by analysts at Standard&Poor’s to represent the economy as a whole. |
| Wilshire 5000: http://www.wilshire.com | Includes essentially all U.S. companies with stock ownership. Despite the name, this index includes about 7,000 firms. |
| New York Stock Exchange: http://www.nyse.com | The oldest and largest U.S. stock market, dating back to 1792. It trades stocks for 2,800 companies of all sizes. It is located at 18 Broad St. in New York City. |
| NASDAQ: http://www.nasdaq.com | Founded in 1971 as an electronic stock market, allowing people to buy or sell from many physical locations. It has about 3,600 companies. |
| FTSE: http://www.ftse.com | Includes the 100 largest companies on the London Stock Exchange. Pronounced “footsie.” Originally stood for Financial Times Stock Exchange. |
| Nikkei: http://www.nikkei.co.jp/nikkeiinfo/en/ | Nikkei stands for Nihon Keizai Shimbun , which translates as the Japan Economic Journal, a major business newspaper in Japan. Index includes the 225 largest and most actively traded stocks on the Tokyo Stock Exchange. |
| DAX: http://www.exchange.de | Tracks 30 of the largest companies on the Frankfurt, Germany, stock exchange. DAX is an abbreviation for Deutscher Aktien Index . |
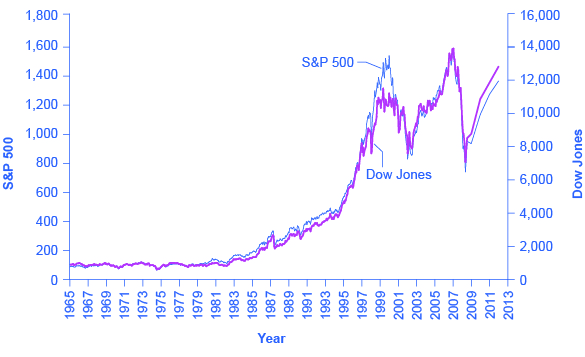
The trend in the stock market is generally up over time, but with some large dips along the way. [link] shows the path of the Standard&Poor’s 500 index (which is measured on the left-hand vertical axis) and the Dow Jones Index (which is measured on the right-hand vertical axis). Broad measures of the stock market, like the ones listed here, tend to move together. The S&P 500 Index is the weighted average market capitalization of the firms selected to be in the index. The Dow Jones Industrial Average is the price weighted average of 30 industrial stocks tracked on the New York Stock Exchange.
When the Dow Jones average rises from 5,000 to 10,000, you know that the average price of the stocks in that index has roughly doubled. [link] shows that stock prices did not rise much in the 1970s, but then started a steady climb in the 1980s. From 2000 to 2013, stock prices bounced up and down, but ended up at about the same level.
[link] shows the total annual rate of return an investor would have received from buying the stocks in the S&P 500 index over recent decades. The total return here includes both dividends paid by these companies and also capital gains arising from increases in the value of the stock. (For technical reasons related to how the numbers are calculated, the dividends and capital gains do not add exactly to the total return.) From the 1950s to the 1980s, the average firm paid annual dividends equal to about 4% of the value of its stock. Since the 1990s, dividends have dropped and now often provide a return closer to 1% to 2%. In the 1960s and 1970s, the gap between percent earned on capital gains and dividends was much closer than it has been since the 1980s. In the 1980s and 1990s, however, capital gains were far higher than dividends. In the 2000s, dividends remained low and, while stock prices fluctuated, they ended the decade roughly where they had started.
Notification Switch
Would you like to follow the 'University of houston downtown: microeconomics' conversation and receive update notifications?

|
|

|
|

|
|

|
|

|
|
|
|
|

|
|

|
|

|
|

|