<< Chapter < Page Chapter >> Page >
By the end of this section, you will be able to:
  • Explain the poverty trap, noting how it is impacted by government programs
  • Identify potential issues in government programs that seek to reduce poverty
  • Calculate a budget constraint line that represents the poverty trap

Can you give people too much help, or the wrong kind of help? When people are provided with food, shelter, healthcare, income, and other necessities, assistance may reduce their incentive to work. Consider a program to fight poverty that works in this reasonable-sounding manner: the government provides assistance to the poor, but as the poor earn income to support themselves, the government reduces the level of assistance it provides. With such a program, every time a poor person earns $100, the person loses $100 in government support. As a result, the person experiences no net gain for working. Economists call this problem the poverty trap    .

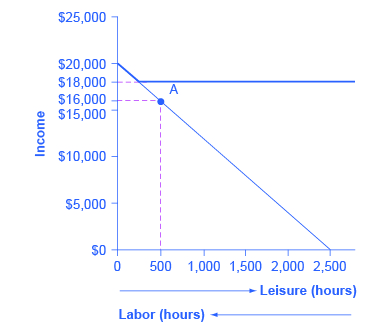
Consider the situation faced by a single-parent family. A single mother (earning $8 an hour) with two children, as illustrated in [link] . First, consider the labor-leisure budget constraint faced by this family in a situation without government assistance. On the horizontal axis is hours of leisure (or time spent with family responsibilities) increasing in quantity from right to left. Also on the horizontal axis is the number of hours at paid work, going from zero hours on the right to the maximum of 2,500 hours on the left. On the vertical axis is the amount of income per year rising from low to higher amounts of income. The budget constraint line shows that at zero hours of leisure and 2,500 hours of work, the maximum amount of income is $20,000 ($8 × 2,500 hours). At the other extreme of the budget constraint line, an individual would work zero hours, earn zero income, but enjoy 2,500 hours of leisure. At point A on the budget constraint line    , by working 40 hours a week, 50 weeks a year, the utility-maximizing choice is to work a total of 2,000 hours per year and earn $16,000.

Now suppose that a government antipoverty program guarantees every family with a single mother and two children $18,000 in income. This is represented on the graph by a horizontal line at $18,000. With this program, each time the mother earns $1,000, the government will deduct $1,000 of its support. [link] shows what will happen at each combination of work and government support.

The poverty trap in action

The graph shows a downward sloping line that begins at $20,000 on the y-axis and ends at 2,500 on the x-axis. A horizontal line extends from $18,000 on the y-axis. A dashed plum line extends from $16,000 on the y-axis and intersects with the vertical line extending from 500 on the x-axis at point A. Beneath the x-axis is an arrow pointing to the right indicating leisure (hours) and an arrow pointing to the left indicating labor (hours).
The original choice is 500 hours of leisure, 2,000 hours of work at point A, and income of $16,000. With a guaranteed income of $18,000, this family would receive $18,000 whether it provides zero hours of work or 2,000 hours of work. Only if the family provides, say, 2,300 hours of work does its income rise above the guaranteed level of $18,000—and even then, the marginal gain to income from working many hours is small.
Total income at various combinations of work and support
Amount Worked (hours) Total Earnings Government Support Total Income
0 0 $18,000 $18,000
500 $4,000 $14,000 $18,000
1,000 $8,000 $10,000 $18,000
1,500 $12,000 $6,000 $18,000
2,000 $16,000 $2,000 $18,000
2,500 $20,000 0 $20,000

Questions & Answers

how do you get the 2/50
Abba Reply
number of sport play by 50 student construct discrete data
Aminu Reply
width of the frangebany leaves on how to write a introduction
Theresa Reply
Solve the mean of variance
Veronica Reply
Step 1: Find the mean. To find the mean, add up all the scores, then divide them by the number of scores. ... Step 2: Find each score's deviation from the mean. ... Step 3: Square each deviation from the mean. ... Step 4: Find the sum of squares. ... Step 5: Divide the sum of squares by n – 1 or N.
kenneth
what is error
Yakuba Reply
Is mistake done to something
Vutshila
Hy
anas
hy
What is the life teble
anas
hy
Jibrin
statistics is the analyzing of data
Tajudeen Reply
what is statics?
Zelalem Reply
how do you calculate mean
Gloria Reply
diveving the sum if all values
Shaynaynay
let A1,A2 and A3 events be independent,show that (A1)^c, (A2)^c and (A3)^c are independent?
Fisaye Reply
what is statistics
Akhisani Reply
data collected all over the world
Shaynaynay
construct a less than and more than table
Imad Reply
The sample of 16 students is taken. The average age in the sample was 22 years with astandard deviation of 6 years. Construct a 95% confidence interval for the age of the population.
Aschalew Reply
Bhartdarshan' is an internet-based travel agency wherein customer can see videos of the cities they plant to visit. The number of hits daily is a normally distributed random variable with a mean of 10,000 and a standard deviation of 2,400 a. what is the probability of getting more than 12,000 hits? b. what is the probability of getting fewer than 9,000 hits?
Akshay Reply
Bhartdarshan'is an internet-based travel agency wherein customer can see videos of the cities they plan to visit. The number of hits daily is a normally distributed random variable with a mean of 10,000 and a standard deviation of 2,400. a. What is the probability of getting more than 12,000 hits
Akshay
1
Bright
Sorry i want to learn more about this question
Bright
Someone help
Bright
a= 0.20233 b=0.3384
Sufiyan
a
Shaynaynay
How do I interpret level of significance?
Mohd Reply
It depends on your business problem or in Machine Learning you could use ROC- AUC cruve to decide the threshold value
Shivam
how skewness and kurtosis are used in statistics
Owen Reply
yes what is it
Taneeya
Got questions? Join the online conversation and get instant answers!
Jobilize.com Reply

Get Jobilize Job Search Mobile App in your pocket Now!

Get it on Google Play Download on the App Store Now


Source:  OpenStax, Principles of economics. OpenStax CNX. Sep 19, 2014 Download for free at http://legacy.cnx.org/content/col11613/1.11
Google Play and the Google Play logo are trademarks of Google Inc.

Notification Switch

Would you like to follow the 'Principles of economics' conversation and receive update notifications?

Ask