

| << Chapter < Page | Chapter >> Page > |
This section of this chapter is here in recognition that what we are now asking requires much more than a quick calculation of a ratio or a square root. Indeed, the use of regression analysis was almost non- existent before the middle of the last century and did not really become a widely used tool until perhaps the late 1960’s and early 1970’s. Even then the computational ability of even the largest IBM machines is laughable by today’s standards. In the early days programs were developed by the researchers and shared. There was no market for something called “software” and certainly nothing called “apps”, an entrant into the market only a few years old.
With the advent of the personal computer and the explosion of a vital software market we have a number of regression and statistical analysis packages to choose from. Each has their merits. We have chosen Microsoft Excel because of the wide-spread availability both on college campuses and in the post-college market place. Stata is an alternative and has features that will be important for more advanced econometrics study if you choose to follow this path. Even more advanced packages exist, but typically require the analyst to do some significant amount of programing to conduct their analysis. The goal of this section is to demonstrate how to use Excel to run a regression and then to do so with an example of a simple version of a demand curve.
The first step to doing a regression using Excel is to load the program into your computer. If you have Excel you have the Analysis ToolPak although you may not have it activated. The program calls upon a significant amount of space so is not loaded automatically.
To activate the Analysis ToolPak follow these steps:
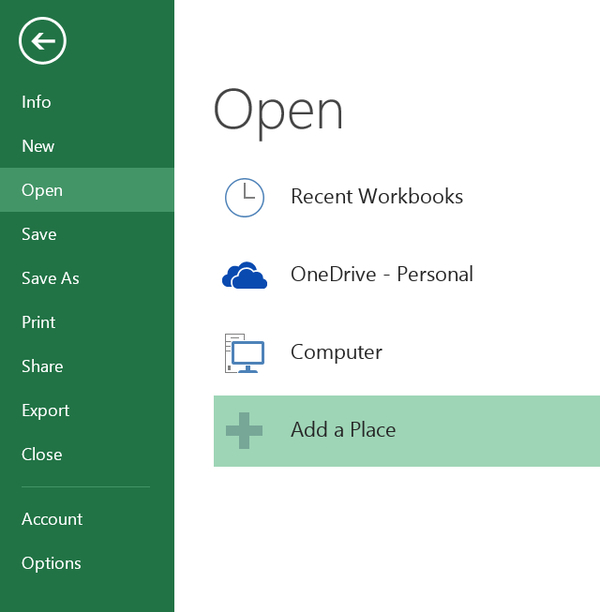
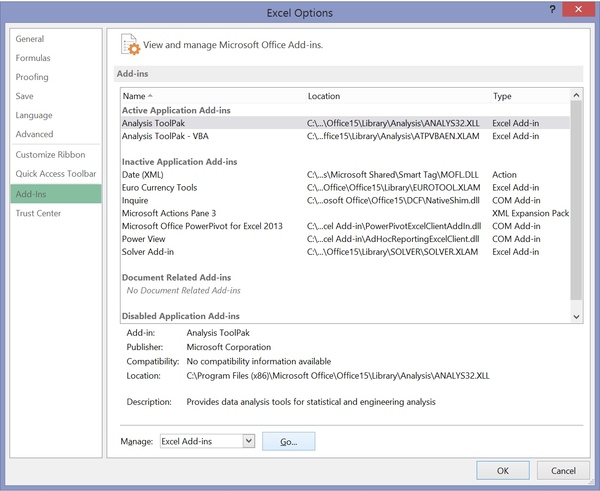
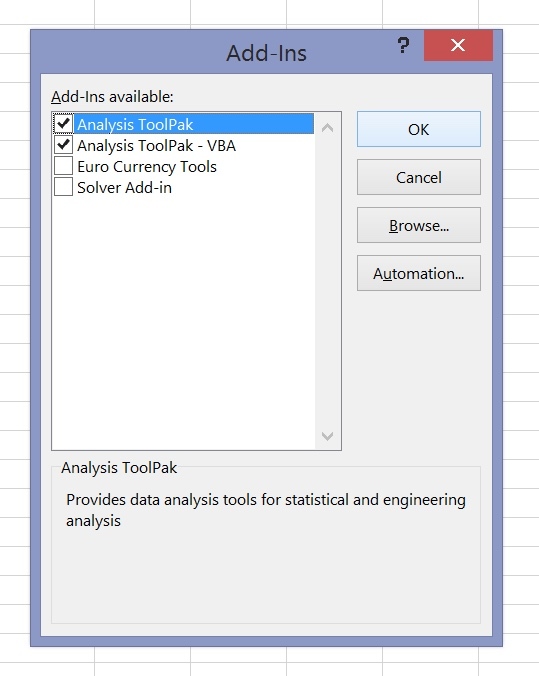
Click “File”>“Options”>“Add-ins” to bring up a menu of the add-in “ToolPaks”. Select “Analysis ToolPak” and click “GO” next to “Manage: excel add-ins” near the bottom of the window. This will open a new window where you click “Analysis ToolPak” (make sure there is a green check mark in the box) and then click “OK”. Now there should be an Analysis tab under the data menu. These steps are presented in the following screen shots.

Click “Data” then “Data Analysis” and then click “Regression” and “OK”. Congratulations, you have made it to the regression window. The window asks for your inputs. Clicking the box next to the Y and X ranges will allow you to use the click and drag feature of Excel to select your input ranges. Excel has one odd quirk and that is the click and drop feature requires that the independent variables, the X variables, are all together, meaning that they form a single matrix. If your data are set up with the Y variable between two columns of X variables Excel will not allow you to use click and drag. As an example, say Column A and Column C are independent variables and Column B is the Y variable, the dependent variable. Excel will not allow you to click and drop the data ranges. The solution is to move the column with the Y variable to column A and then you can click and drag. The same problem arises again if you want to run the regression with only some of the X variables. You will need to set up the matrix so all the X variables you wish to regress are in a tightly formed matrix. These steps are presented in the following scene shots.
Notification Switch
Would you like to follow the 'Introductory statistics' conversation and receive update notifications?

|
|

|
|

|
|

|
|

|
|

|
|

|
|

|
|

|
|
|
|