The p-value is 0.026 (from LinRegTTest on your calculator or from computer software)
The p-value, 0.026, is less than the significance level of
= 0.05
Decision: Reject the Null Hypothesis
Conclusion: There is sufficient evidence to conclude that there is a significant linear relationship between
and
because the correlation coefficient is significantly different from 0.
Because
is significant and the scatter plot shows a linear trend, the regression line can be used to predict final exam scores.
Method 2: using a table of critical values to make a decision
The
95% Critical Values of the Sample Correlation Coefficient Table at the end of
this chapter (before the
Summary ) may be used to give you a good idea of whether the
computed value of
is significant or not . Compare
to the appropriate critical value in
the table. If
is not between the positive and negative critical values, then the correlation coefficient is significant. If
is significant, then you may want to use the line for prediction.
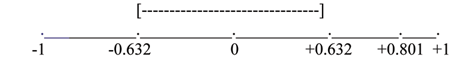
Suppose you computed
using
data points.
. The critical values associated with
are -0.632 and
+ 0.632. If
or
, then
is
significant. Since
and
,
is significant and the line may be used
for prediction. If you view this example on a number line, it will help you.
is not significant between -0.632 and +0.632.
. Therefore,
is significant.
Suppose you computed
with 14 data points.
. The critical values are -0.532 and 0.532. Since
,
is significant and
the line may be used for prediction
. Therefore,
is significant.
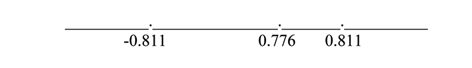
Suppose you computed
and
.
. The
critical values are -0.811 and 0.811. Since
,
is not significant
and the line should not be used for prediction.
. Therefore,
is not significant.
Third exam vs final exam example: critical value method
The line of best fit is:
with
and there are
data points.
Can the regression line be used for prediction?
Given a third exam score (
value), can we
use the line to predict the final exam score (predicted
value)?
:
= 0
:
≠ 0
= 0.05
Use the "95% Critical Value" table for
with
The critical values are -0.602 and +0.602
Since
,
is significant.
Decision: Reject
:
Conclusion:There is sufficient evidence to conclude that there is a significant linear relationship between
and
because the correlation coefficient is significantly different from 0.
Because
is significant and the scatter plot shows a linear trend, the regression line can be used to predict final exam scores.
Additional practice examples using critical values
Suppose you computed the following correlation coefficients. Using the
table at the end of the chapter, determine if
is significant and the line of best fit associated
with each
can be used to predict a
value. If it helps, draw a number line.
and the sample size,
, is 19. The
. The critical value is -0.456.
so
is significant.
and the sample size,
, is 9. The
. The critical value is 0.666.
so
is significant.
and the sample size,
, is 14. The
. The critical value is 0.532. 0.134 is between -0.532 and 0.532 so
is not significant.
and the sample size,
, is 5. No matter what the dfs are,
is between the two critical values so
is not significant.
Assumptions in testing the significance of the correlation coefficient
Testing the significance of the correlation coefficient requires that certain assumptions about the data are satisfied. The premise of this test is that the data are a sample of observed points taken from a larger population. We have not examined the entire population because it is not possible or feasible to do so. We are examining the sample to draw a conclusion about whether the linear relationship that we see between
and
in the sample data provides strong enough evidence so that we can conclude that there is a linear relationship between
and
in the population.
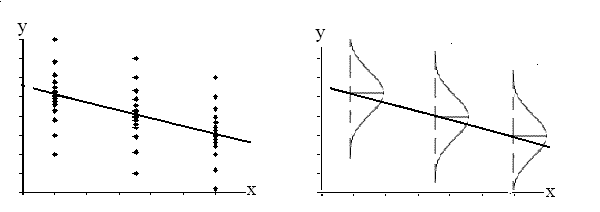
The regression line equation that we calculate from the sample data gives the best fit line for our particular sample. We want to use this best fit line for the sample as an estimate of the best fit line for the population. Examining the scatterplot and testing the significance of the correlation coefficient helps us determine if it is appropriate to do this.
The assumptions underlying the test of significance are:
There is a linear relationship in the population that models the average value of
for varying values of
. In other words, the expected value of
for each particular
value lies on a straight line in the population. (We do not know the equation for the line for the population. Our regression line from the sample is our best estimate of this line in the population.)
The
values for any particular
value are normally distributed about the line. This implies that there are more
values scattered closer to the line than are scattered farther away. Assumption (1) above implies that these normal distributions are centered on the line: the means of these normal distributions of
values lie on the line.
The standard deviations of the population
values about the line are equal for each value of
. In other words, each of these normal distributions of
values has the same shape and spread about the line.
The residual errors are mutually independent (no pattern).
The y values for each x value are normally distributed about the line with the same standard deviation. For each x value, the mean of the y values lies on the regression line. More y values lie near the line than are scattered further away from the line.
**With contributions from Roberta Bloom
Questions & Answers
Discuss the differences between taste and flavor, including how other sensory inputs contribute to our perception of flavor.
The lymphatic system plays several crucial roles in the human body, functioning as a key component of the immune system and contributing to the maintenance of fluid balance. Its main functions include:
1. Immune Response: The lymphatic system produces and transports lymphocytes, which are a type of
asegid
to transport fluids fats proteins and lymphocytes to the blood stream as lymph
Anatomy is the study of the structure of the body, while physiology is the study of the function of the body. Anatomy looks at the body's organs and systems, while physiology looks at how those organs and systems work together to keep the body functioning.
Enzymes are proteins that help speed up chemical reactions in our bodies. Enzymes are essential for digestion, liver function and much more. Too much or too little of a certain enzyme can cause health problems
Kamara
yes
Prince
how does the stomach protect itself from the damaging effects of HCl
the normal temperature is 37°c or 98.6 °Fahrenheit is important for maintaining the homeostasis in the body
the body regular this temperature through the process called thermoregulation which involves brain skin muscle and other organ working together to maintain stable internal temperature