Home
Collaborative statistics: custom Appendix Notes for the ti-83, 83+, 84
To deselect equations:
Access the list of equations.
Select each equal sign (=).
Continue, until all equations are deselected.
To clear equations:
Access the list of equations.
Use the arrow keys to navigate to the right of each equal sign (=) and clear them.
Repeat until all equations are deleted.
To draw default histogram:
Access the ZOOM menu.
Select
<9:ZoomStat>
The histogram will show with a window automatically set.
To draw custom histogram:
Access
to set the graph parameters.
X
min
2.5
X
max
3.5
X
scl
1 (width of bars)
Y
min
0
Y
max
10
Y
scl
1 (spacing of tick marks on y-axis)
X
res
1
Access
to see the histogram.
To draw box plots:
Access graphing mode.
,
[STAT PLOT]
Select
<1:Plot 1> to access the first graph.
Use the arrows to select
<ON> and turn on Plot 1.
Use the arrows to select the box plot picture and enable it.
Use the arrows to navigate to
<Xlist>
If "L1" is not selected, select it.
,
[L1] ,
Use the arrows to navigate to
<Freq> .
Indicate that the frequencies are in
[L2] .
,
[L2] ,
Go back to access other graphs.
,
[STAT PLOT]
Be sure to deselect or clear all equations before graphing using the method mentioned above.
View the box plot.
,
[STAT PLOT]
Linear regression
Sample data
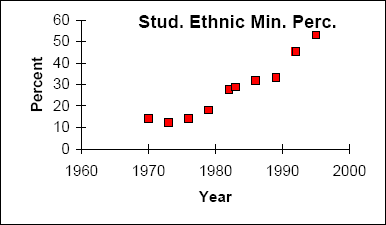
The following data is real. The percent of declared ethnic minority students at De Anza College for selected years from 1970 - 1995 was:
Year
Student Ethnic Minority Percentage
1970
14.13
1973
12.27
1976
14.08
1979
18.16
1982
27.64
1983
28.72
1986
31.86
1989
33.14
1992
45.37
1995
53.1
The independent variable is "Year," while the independent variable is "Student Ethnic Minority Percent."
Student ethnic minority percentage
By hand, verify the scatterplot above.
The TI-83 has a built-in linear regression feature, which allows the data to be edited.The x-values will be in
[L1] ; the y-values in
[L2] .
To enter data and do linear regression:
ON Turns calculator on
Before accessing this program, be sure to turn off all plots.
Access graphing mode.
,
[STAT PLOT]
Turn off all plots.
,
Round to 3 decimal places. To do so:
Access the mode menu.
,
[STAT PLOT]
Navigate to
<Float> and then to the right to
<3> .
All numbers will be rounded to 3 decimal places until changed.
Enter statistics mode and clear lists
[L1] and
[L2] , as describe above.
,
Enter editing mode to insert values for x and y.
,
Enter each value. Press
to continue.
To display the correlation coefficient:
Access the catalog.
,
[CATALOG]
Arrow down and select
<DiagnosticOn>
... ,
,
r and
r
2 will be displayed during regression calculations.
Access linear regression.
Select the form of
y
a
b
x
,
The display will show:
Linreg
y
a
b
x
a
3176.909
b
1.617
r
2
0.924
r
0.961
This means the Line of Best Fit (Least Squares Line) is:
y
3176.909
1.617
x
Percent
3176.909
1.617
(year #) The correlation coefficient
r
0.961
To see the scatter plot:
Access graphing mode.
,
[STAT PLOT]
Select
<1:plot 1> To access plotting - first graph.
Navigate and select
<ON> to turn on Plot 1.
<ON>
Navigate to the first picture.
Select the scatter plot.
Navigate to
<Xlist>
If
[L1] is not selected, press
,
[L1] to select it.
Confirm that the data values are in
[L1] .
<ON>
Navigate to
<Ylist>
Select that the frequencies are in
[L2] .
,
[L2] ,
Go back to access other graphs.
,
[STAT PLOT]
Use the arrows to turn off the remaining plots.
Access
to set the graph parameters.
X
min
1970
X
max
2000
X
scl
10 (spacing of tick marks on x-axis)
Y
min
0.05
Y
max
60
Y
scl
10 (spacing of tick marks on y-axis)
X
res
1
Be sure to deselect or clear all equations before graphing, using the instructions above.
Press
to see the scatter plot.
Questions & Answers
how does Neisseria cause meningitis
is the branch of biology that deals with the study of microorganisms.
studies of microbes
Louisiaste
when we takee the specimen which lumbar,spin,
How bacteria create energy to survive?
Bacteria doesn't produce energy they are dependent upon their substrate in case of lack of nutrients they are able to make spores which helps them to sustain in harsh environments
_Adnan
But not all bacteria make spores, l mean Eukaryotic cells have Mitochondria which acts as powerhouse for them, since bacteria don't have it, what is the substitution for it?
Muhamad
they make spores
Louisiaste
what is sporadic nd endemic, epidemic
the significance of food webs for disease transmission
Abreham
food webs brings about an infection as an individual depends on number of diseased foods or carriers dully.
Mark
explain assimilatory nitrate reduction
Assimilatory nitrate reduction is a process that occurs in some microorganisms, such as bacteria and archaea, in which nitrate (NO3-) is reduced to nitrite (NO2-), and then further reduced to ammonia (NH3).
Elkana
This process is called assimilatory nitrate reduction because the nitrogen that is produced is incorporated in the cells of microorganisms where it can be used in the synthesis of amino acids and other nitrogen products
Elkana
Examples of thermophilic organisms
Give Examples of thermophilic organisms
Shu
advantages of normal Flora to the host
Prevent foreign microbes to the host
Abubakar
they provide healthier benefits to their hosts
ayesha
They are friends to host only when Host immune system is strong and become enemies when the host immune system is weakened . very bad relationship!
Mark
cell is the smallest unit of life
Fauziya
cell is the smallest unit of life
Akanni
cell is the structural and functional unit of life
Hasan
is the fundamental units of Life
Musa
what are emergency diseases
There are nothing like emergency disease but there are some common medical emergency which can occur simultaneously like Bleeding,heart attack,Breathing difficulties,severe pain heart stock.Hope you will get my point .Have a nice day ❣️
_Adnan
define infection ,prevention and control
Innocent
I think infection prevention and control is the avoidance of all things we do that gives out break of infections and promotion of health practices that promote life
Lubega
Heyy Lubega hussein where are u from?
_Adnan
which site have a normal flora
Many sites of the body have it
Skin
Nasal cavity
Oral cavity
Gastro intestinal tract
Safaa
skin,Oral,Nasal,GIt
Sadik
How can Commensal can Bacteria change into pathogen?
Sadik
How can Commensal Bacteria change into pathogen?
Sadik
what are the advantages of normal Flora to the host
Micheal
what are the ways of control and prevention of nosocomial infection in the hospital
Micheal
part of a tissue or an organ being wounded or bruised.
Wilfred
what term is used to name and classify microorganisms?
Binomial nomenclature
adeolu
Got questions? Join the online conversation and get instant answers!
Source:
OpenStax, Collaborative statistics: custom version modified by v moyle. OpenStax CNX. Nov 14, 2010 Download for free at http://legacy.cnx.org/content/col11238/1.2
Google Play and the Google Play logo are trademarks of Google Inc.