<< Chapter < Page Chapter >> Page >
This module provides an overview of Linear Regression and Correlation: Scatter Plots as a part of Collaborative Statistics collection (col10522) by Barbara Illowsky and Susan Dean.

Before we take up the discussion of linear regression and correlation, we need to examine a way to display the relation between two variables x and y . The most common and easiest way is a scatter plot . The following example illustrates a scatter plot.

From an article in the Wall Street Journal : In Europe and Asia, m-commerce is popular. M-commerce users have special mobilephones that work like electronic wallets as well as provide phone and Internet services. Users can do everything from paying for parking to buying a TV set or soda from amachine to banking to checking sports scores on the Internet. For the years 2000 through 2004, was there a relationship between the year and the number of m-commerce users?Construct a scatter plot. Let x = the year and let y = the number of m-commerce users, in millions.

x (year) y (# of users)
2000 0.5
2002 20.0
2003 33.0
2004 47.0
Table showing the number of m-commerce users (in millions) by year.
A scatter plot with the x-axis representing the year and the y-axis representing the number of m-commerce users in millions.  There are four points plotted, at (2000, 0.5), (2002, 20.0), (2003, 33.0), (2004, 47.0).
Scatter plot showing the number of m-commerce users (in millions) by year.
Got questions? Get instant answers now!

A scatter plot shows the direction and strength of a relationship between the variables. A clear direction happens when there is either:

  • High values of one variable occurring with high values of the other variable or low values of one variable occurring with low values of the other variable.
  • High values of one variable occurring with low values of the other variable.

You can determine the strength of the relationship by looking at the scatter plot and seeing how close the points are to a line, a power function, an exponential function,or to some other type of function.

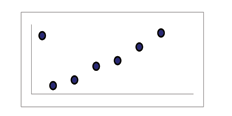
When you look at a scatterplot, you want to notice the overall pattern and any deviations from the pattern. The following scatterplot examples illustrate these concepts.

Positive linear pattern (strong)

Scatterplot of 6 points in a straight ascending line from lower left to upper right.

Linear pattern w/ one deviation

Scatterplot of 6 points in a straight ascending line from lower left to upper right with one additional point in the upper left corner.

Negative linear pattern (strong)

Scatterplot of 6 points in a straight descending line from upper left to lower right.

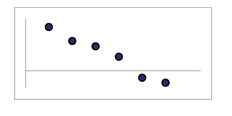
Negative linear pattern (weak)

Scatterplot of 8 points in a wobbly descending line from upper left to lower right.

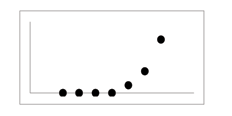
Exponential growth pattern
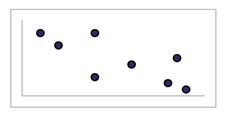
Scatterplot of 7 points in a exponential curve from along the x-axis on the left to slowly ascending up the graph in the upper right.

No pattern

Scatterplot of many points scattered everywhere.

In this chapter, we are interested in scatter plots that show a linear pattern. Linear patterns are quite common. The linear relationship is strong if the points are close to a straight line.If we think that the points show a linear relationship, we would like to draw a line on the scatter plot. This line can be calculated through a process called linear regression . However, we only calculate a regression line if one of the variables helps to explain orpredict the other variable. If x is the independent variable and y the dependent variable, then we can use a regression line to predict y for a given value of x .

Questions & Answers

what is biology
Hajah Reply
the study of living organisms and their interactions with one another and their environments
AI-Robot
what is biology
Victoria Reply
HOW CAN MAN ORGAN FUNCTION
Alfred Reply
the diagram of the digestive system
Assiatu Reply
allimentary cannel
Ogenrwot
How does twins formed
William Reply
They formed in two ways first when one sperm and one egg are splited by mitosis or two sperm and two eggs join together
Oluwatobi
what is genetics
Josephine Reply
Genetics is the study of heredity
Misack
how does twins formed?
Misack
What is manual
Hassan Reply
discuss biological phenomenon and provide pieces of evidence to show that it was responsible for the formation of eukaryotic organelles
Joseph Reply
what is biology
Yousuf Reply
the study of living organisms and their interactions with one another and their environment.
Wine
discuss the biological phenomenon and provide pieces of evidence to show that it was responsible for the formation of eukaryotic organelles in an essay form
Joseph Reply
what is the blood cells
Shaker Reply
list any five characteristics of the blood cells
Shaker
lack electricity and its more savely than electronic microscope because its naturally by using of light
Abdullahi Reply
advantage of electronic microscope is easily and clearly while disadvantage is dangerous because its electronic. advantage of light microscope is savely and naturally by sun while disadvantage is not easily,means its not sharp and not clear
Abdullahi
cell theory state that every organisms composed of one or more cell,cell is the basic unit of life
Abdullahi
is like gone fail us
DENG
cells is the basic structure and functions of all living things
Ramadan
What is classification
ISCONT Reply
is organisms that are similar into groups called tara
Yamosa
in what situation (s) would be the use of a scanning electron microscope be ideal and why?
Kenna Reply
A scanning electron microscope (SEM) is ideal for situations requiring high-resolution imaging of surfaces. It is commonly used in materials science, biology, and geology to examine the topography and composition of samples at a nanoscale level. SEM is particularly useful for studying fine details,
Hilary
cell is the building block of life.
Condoleezza Reply
Got questions? Join the online conversation and get instant answers!
Jobilize.com Reply

Get Jobilize Job Search Mobile App in your pocket Now!

Get it on Google Play Download on the App Store Now


Source:  OpenStax, Collaborative statistics. OpenStax CNX. Jul 03, 2012 Download for free at http://cnx.org/content/col10522/1.40
Google Play and the Google Play logo are trademarks of Google Inc.

Notification Switch

Would you like to follow the 'Collaborative statistics' conversation and receive update notifications?

Ask