

| << Chapter < Page | Chapter >> Page > |
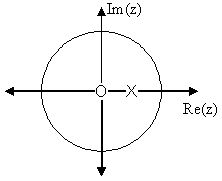
For this example, a more complex transfer function is analyzed in order to represent the system's frequencyresponse.
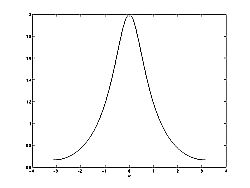
Below we can see the two figures described by the above equations. The [link] represents the basic pole/zero plot of the z-transform, . [link] shows the magnitude of the frequency response. From the formulas and statements in the previoussection, we can see that when the frequency will peak since it is at this value of that the pole is closest to the unit circle. The ratio from [link] helps us see the mathematics behind this conclusion and the relationship between the distancesfrom the unit circle and the poles and zeros. As moves from to , we see how the zero begins to mask the effects of the poleand thus force the frequency response closer to .
The Butterworth filter is the simplest filter. It can be constructed out of passive R, L, C circuits. The magnitude of the transferfunction for this filter is

The important aspects of [link] are that it does not ripple in the passband or stopband as otherfilters tend to, and that the larger , the sharper the cutoff (the smaller the transition band ).
Butterworth filters give transfer functions ( and ) that are rational functions . They also have only poles , resulting in a transfer function of the form
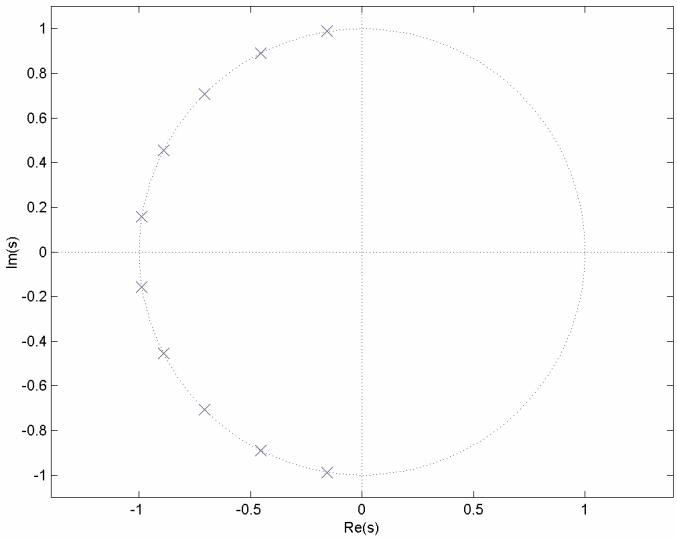
Note that the poles lie along a circle in the s-plane.
The Butterworth filter does not give a sufficiently good approximation across the complete passband in many cases. TheTaylor's series approximation is often not suited to the way specifications are given for filters. An alternate error measure isthe maximum of the absolute value of the difference between the actual filter response and the ideal. This is considered over thetotal passband. This is the Chebyshev error measure and was defined and applied to the FIR filter design problem. For the IIR filter,the Chebyshev error is minimized over the passband and a Taylor's series approximation at is used to determine the stopband performance. This mixture of methods in the IIR case iscalled the Chebyshev filter, and simple design formulas result, just as for the Butterworth filter.
The design of Chebyshev filters is particularly interesting, because the results of a very elegant theory insure thatconstructing a frequency-response function with the proper form of equal ripple in the error will result in a minimum Chebyshev errorwithout explicitly minimizing anything. This allows a straightforward set of design formulas to be derived which can beviewed as a generalization of the Butterworth formulas [link] , [link] .
Notification Switch
Would you like to follow the 'Signals and systems' conversation and receive update notifications?

|
|

|
|

|
|

|
|

|
|

|
|

|
|

|
|

|
|

|