

| << Chapter < Page | Chapter >> Page > |
In this section we will discuss techniques using spreadsheet for exploring Chi-Square
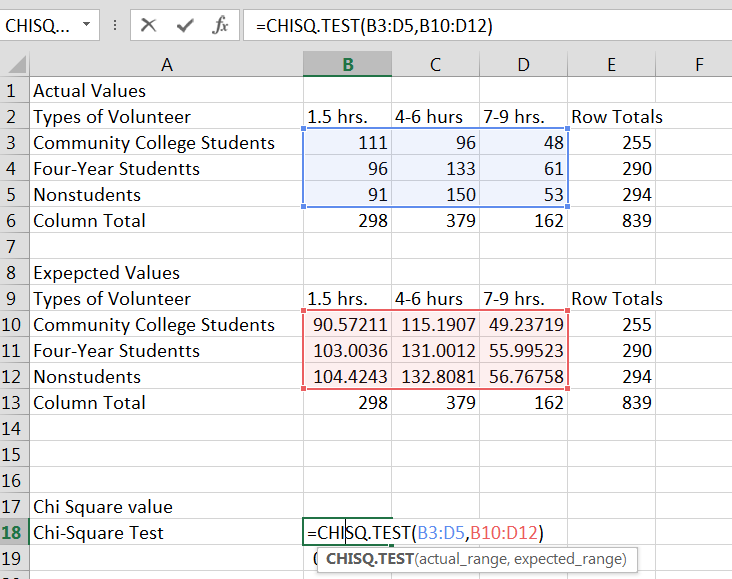
In Excel and in Google Spreadsheet we will need to enter equations (as we did before) to generate the Chi-Square Expected Values before using the built in formulas. The built in formulas ask for the actual values and the expected values. To generate these values, we have created the following demonstration using the example 11.2 from the chapter. You can generate this type of contingency table using Pivot Tables. We will demonstrate how to use that table to create a table for expected values.
| A | B | C | D | E | |
|---|---|---|---|---|---|
| 2 | Type of Volunteer | 1-3 hrs. | 4-6 hrs. | 7-9 hrs. | Row Total |
| 3 | Community College Students | 111 | 96 | 48 | 255 |
| 4 | Four-Year College Students | 96 | 133 | 61 | 290 |
| 5 | Nonstudents | 91 | 150 | 53 | 294 |
| 6 | Column Total | 298 | 379 | 162 | 839 |
Using the cell addresses as above I will create the expected values using these formulas.

You will now have the data you need to use the Chisq.test formula. Pick a cell on your spreadsheet where you would like the results. For this example we picked cell B16, so in cell A16 I entered my label. In cell B16 I typed, =chisq.test. The menu then pops up and lets you know to enter the actual values and the expected values. Once you select the cells that contain your actual and expected values the p-value for the chi-square test will appear. Observe the following two screenshots.

If you are more interested in the actual Chi-Square calculation based on the sum of the (observed-expected)^2 / expected rather than the p-value output which is given by the above formula, we would need to create one more set of data, to create the Chi-Square sum value below you will see the set up.
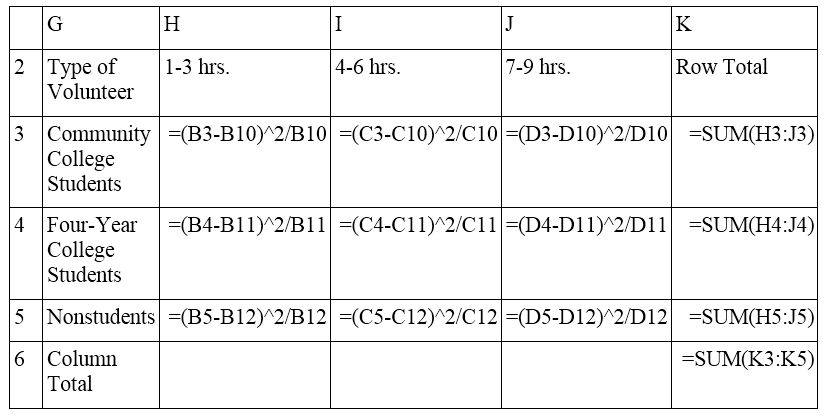
These values will produce the following results.

A Chi-Square sum value of 12.99
To graph Chi-Square Distribution use the “Statistics Online Computational Resources (SOCR)” (just as in the previous chapter) at
http://socr.ucla.edu/htmls/SOCR_Distributions.html has in the dropdown menu for SOCR distribution the Chi-Square distribution. For the Chi-Square distribution, you will only need the Degrees of Freedom (c-1)*(r-1). You can then enter your right cut off values (which in this case will be your critical values). Below is a graph of the Chi distribution for the above example.

Note that our value of 12.99 gives us the probability value that we calculated using the Excel chisq.test.
At your computer, try to use some of these tools to work out your homework problems or check homework that you have completed to see if the results are the same or similar.
Notification Switch
Would you like to follow the 'Collaborative statistics using spreadsheets' conversation and receive update notifications?

|
|
|
|
|

|
|

|
|

|
|

|
|

|
|

|
|

|
|

|