<< Chapter < Page Chapter >> Page >

By the end of this section, you will be able to:

  • Evaluate the appropriate competition policy for a natural monopoly
  • Interpret a graph of regulatory choices
  • Contrast cost-plus and price cap regulation

Most true monopolies today in the U.S. are regulated, natural monopolies. A natural monopoly poses a difficult challenge for competition policy, because the structure of costs and demand seems to make competition unlikely or costly. A natural monopoly    arises when average costs are declining over the range of production that satisfies market demand. This typically happens when fixed costs are large relative to variable costs. As a result, one firm is able to supply the total quantity demanded in the market at lower cost than two or more firms—so splitting up the natural monopoly would raise the average cost of production and force customers to pay more.

Public utilities, the companies that have traditionally provided water and electrical service across much of the United States, are leading examples of natural monopoly. It would make little sense to argue that a local water company should be broken up into several competing companies, each with its own separate set of pipes and water supplies. Installing four or five identical sets of pipes under a city, one for each water company, so that each household could choose its own water provider, would be terribly costly. The same argument applies to the idea of having many competing companies for delivering electricity to homes, each with its own set of wires. Before the advent of wireless phones, the argument also applied to the idea of many different phone companies, each with its own set of phone wires running through the neighborhood.

The choices in regulating a natural monopoly

So what then is the appropriate competition policy for a natural monopoly? [link] illustrates the case of natural monopoly, with a market demand curve that cuts through the downward-sloping portion of the average cost curve . Points A, B, C, and F illustrate four of the main choices for regulation. [link] outlines the regulatory choices for dealing with a natural monopoly.
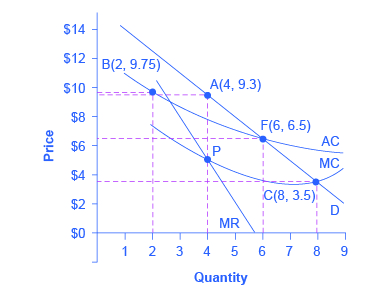
Regulatory choices in dealing with natural monopoly

The graph represents a natural monopoly. The graph shows four points that represent the main choices for regulation, a downward-sloping average cost curve, and a downward-sloping market demand curve.
A natural monopoly will maximize profits by producing at the quantity where marginal revenue (MR) equals marginal costs (MC) and by then looking to the market demand curve to see what price to charge for this quantity. This monopoly will produce at point A, with a quantity of 4 and a price of 9.3. If antitrust regulators split this company exactly in half, then each half would produce at point B, with average costs of 9.75 and output of 2. The regulators might require the firm to produce where marginal cost crosses the market demand curve at point C. However, if the firm is required to produce at a quantity of 8 and sell at a price of 3.5, the firm will suffer from losses. The most likely choice is point F, where the firm is required to produce a quantity of 6 and charge a price of 6.5.
(*Total Revenue is given by multiplying price and quantity. However, some of the price values in this table have been rounded for ease of presentation.)
Regulatory choices in dealing with natural monopoly
Quantity Price Total Revenue * Marginal Revenue Total Cost Marginal Cost Average Cost
1 14.7 14.7 - 11.0 - 11.00
2 12.4 24.7 10.0 19.5 8.5 9.75
3 10.6 31.7 7.0 25.5 6.0 8.50
4 9.3 37.2 5.5 31.0 5.5 7.75
5 8.0 40.0 2.8 35.0 4.0 7.00
6 6.5 39.0 –1.0 39.0 4.0 6.50
7 5.0 35.0 –4.0 42.0 3.0 6.00
8 3.5 28.0 –7.0 45.5 3.5 5.70
9 2.0 18.0 –10.0 49.5 4.0 5.5

Questions & Answers

how do you get the 2/50
Abba Reply
number of sport play by 50 student construct discrete data
Aminu Reply
width of the frangebany leaves on how to write a introduction
Theresa Reply
Solve the mean of variance
Veronica Reply
Step 1: Find the mean. To find the mean, add up all the scores, then divide them by the number of scores. ... Step 2: Find each score's deviation from the mean. ... Step 3: Square each deviation from the mean. ... Step 4: Find the sum of squares. ... Step 5: Divide the sum of squares by n – 1 or N.
kenneth
what is error
Yakuba Reply
Is mistake done to something
Vutshila
Hy
anas
hy
What is the life teble
anas
hy
Jibrin
statistics is the analyzing of data
Tajudeen Reply
what is statics?
Zelalem Reply
how do you calculate mean
Gloria Reply
diveving the sum if all values
Shaynaynay
let A1,A2 and A3 events be independent,show that (A1)^c, (A2)^c and (A3)^c are independent?
Fisaye Reply
what is statistics
Akhisani Reply
data collected all over the world
Shaynaynay
construct a less than and more than table
Imad Reply
The sample of 16 students is taken. The average age in the sample was 22 years with astandard deviation of 6 years. Construct a 95% confidence interval for the age of the population.
Aschalew Reply
Bhartdarshan' is an internet-based travel agency wherein customer can see videos of the cities they plant to visit. The number of hits daily is a normally distributed random variable with a mean of 10,000 and a standard deviation of 2,400 a. what is the probability of getting more than 12,000 hits? b. what is the probability of getting fewer than 9,000 hits?
Akshay Reply
Bhartdarshan'is an internet-based travel agency wherein customer can see videos of the cities they plan to visit. The number of hits daily is a normally distributed random variable with a mean of 10,000 and a standard deviation of 2,400. a. What is the probability of getting more than 12,000 hits
Akshay
1
Bright
Sorry i want to learn more about this question
Bright
Someone help
Bright
a= 0.20233 b=0.3384
Sufiyan
a
Shaynaynay
How do I interpret level of significance?
Mohd Reply
It depends on your business problem or in Machine Learning you could use ROC- AUC cruve to decide the threshold value
Shivam
how skewness and kurtosis are used in statistics
Owen Reply
yes what is it
Taneeya
Got questions? Join the online conversation and get instant answers!
Jobilize.com Reply

Get Jobilize Job Search Mobile App in your pocket Now!

Get it on Google Play Download on the App Store Now


Source:  OpenStax, Principles of economics. OpenStax CNX. Sep 19, 2014 Download for free at http://legacy.cnx.org/content/col11613/1.11
Google Play and the Google Play logo are trademarks of Google Inc.

Notification Switch

Would you like to follow the 'Principles of economics' conversation and receive update notifications?

Ask