<< Chapter < Page Chapter >> Page >
By the end of this section, you will be able to:
  • Plot points on a rectangular coordinate system
  • Identify points on a graph
  • Verify solutions to an equation in two variables
  • Complete a table of solutions to a linear equation
  • Find solutions to linear equations in two variables

Before you get started, take this readiness quiz.

  1. Evaluate: x + 3 when x = −1 .
    If you missed this problem, review Add Integers .
  2. Evaluate: 2 x 5 y when x = 3 , y = −2 .
    If you missed this problem, review Multiply and Divide Integers .
  3. Solve for y : 40 4 y = 20 .
    If you missed this problem, review Solve Equations with Variables and Constants on Both Sides .

Plot points on a rectangular coordinate system

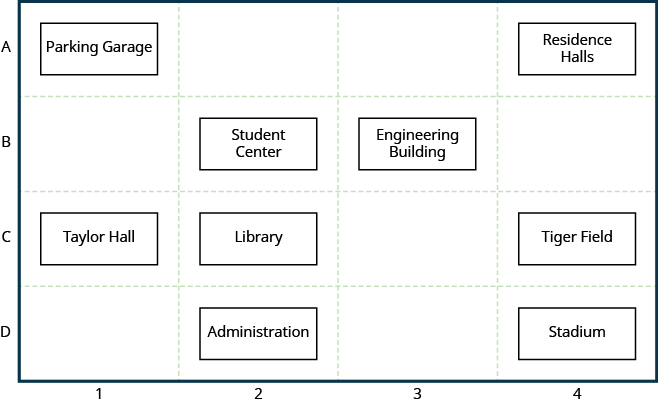
Many maps, such as the Campus Map shown in [link] , use a grid system to identify locations. Do you see the numbers 1 , 2 , 3 , and 4 across the top and bottom of the map and the letters A, B, C, and D along the sides? Every location on the map can be identified by a number and a letter.

For example, the Student Center is in section 2B. It is located in the grid section above the number 2 and next to the letter B. In which grid section is the Stadium? The Stadium is in section 4D.

The figure shows a labeled grid representing the Campus Map. The columns are labeled 1 through 4 and the rows are labeled A through D. At position A-1 is the title Parking Garage. At position A-4 is a rectangle labeled Residence Halls. At position B-2 is a rectangle labeled Student Center. At position B-3 is a rectangle labeled Engineering Building. At position C-1 is a rectangle labeled Taylor Hall. At position C-2 is a rectangle labeled Library.  At position C-4 is a rectangle labeled Tiger Field. At position D-4 is a rectangle labeled Stadium.

Use the map in [link] .

  1. Find the grid section of the Residence Halls.
  2. What is located in grid section 4C?

Solution

  1. Read the number below the Residence Halls, 4 , and the letter to the side, A. So the Residence Halls are in grid section 4A.
  2. Find 4 across the bottom of the map and C along the side. Look below the 4 and next to the C. Tiger Field is in grid section 4C.
Got questions? Get instant answers now!

Use the map in [link] .

  1. Find the grid section of Taylor Hall.
  2. What is located in section 3B?
  1. 1C
  2. Engineering Building
Got questions? Get instant answers now!

Use the map in [link] .

  1. Find the grid section of the Parking Garage.
  2. What is located in section 2C?
  1. 1A
  2. Library
Got questions? Get instant answers now!

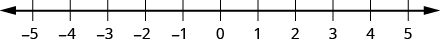
Just as maps use a grid system to identify locations, a grid system is used in algebra to show a relationship between two variables in a rectangular coordinate system. To create a rectangular coordinate system, start with a horizontal number line. Show both positive and negative numbers as you did before, using a convenient scale unit. This horizontal number line is called the x -axis    .

The figure shows a number line with integer values labeled from -5 to 5.

Now, make a vertical number line passing through the x -axis at 0 . Put the positive numbers above 0 and the negative numbers below 0 . See [link] . This vertical line is called the y -axis    .

Vertical grid lines pass through the integers marked on the x -axis . Horizontal grid lines pass through the integers marked on the y -axis . The resulting grid is the rectangular coordinate system.

The rectangular coordinate system is also called the x - y plane, the coordinate plane, or the Cartesian coordinate system (since it was developed by a mathematician named René Descartes.)

The graph shows the x y-coordinate plane. The x and y-axis each run from -7 to 7.  An arrow points to the horizontal axis with the label “x-axis”. An arrow points to the vertical axis with label “y-axis”. An arrow points to the intersection of the axes with label “origin”.
The rectangular coordinate system.

The x -axis and the y -axis form the rectangular coordinate system. These axes divide a plane into four areas, called quadrants    . The quadrants are identified by Roman numerals, beginning on the upper right and proceeding counterclockwise. See [link] .

The graph shows the x y-coordinate plane. The x and y-axis each run from -7 to 7. The top-right portion of the plane is labeled “I”, the top-left portion of the plane is labeled “II”, the bottom-left portion of the plane is labelled “III” and the bottom-right portion of the plane is labeled “IV”
The four quadrants of the rectangular coordinate system

In the rectangular coordinate system, every point is represented by an ordered pair    . The first number in the ordered pair is the x -coordinate of the point, and the second number is the y -coordinate of the point.

Practice Key Terms 7

Get Jobilize Job Search Mobile App in your pocket Now!

Get it on Google Play Download on the App Store Now


Source:  OpenStax, Prealgebra. OpenStax CNX. Jul 15, 2016 Download for free at http://legacy.cnx.org/content/col11756/1.9
Google Play and the Google Play logo are trademarks of Google Inc.

Notification Switch

Would you like to follow the 'Prealgebra' conversation and receive update notifications?

Ask