

| << Chapter < Page | Chapter >> Page > |
| Perception | Physical quantity |
|---|---|
| Pitch | Frequency |
| Loudness | Intensity and Frequency |
| Timbre | Number and relative intensity of multiple frequencies.
Subtle craftsmanship leads to non-linear effects and more detail. |
| Note | Basic unit of music with specific names, combined to generate tunes |
| Tone | Number and relative intensity of multiple frequencies. |
When a violin plays middle C, there is no mistaking it for a piano playing the same note. The reason is that each instrument produces a distinctive set of frequencies and intensities. We call our perception of these combinations of frequencies and intensities tone quality, or more commonly the timbre of the sound. It is more difficult to correlate timbre perception to physical quantities than it is for loudness or pitch perception. Timbre is more subjective. Terms such as dull, brilliant, warm, cold, pure, and rich are employed to describe the timbre of a sound. So the consideration of timbre takes us into the realm of perceptual psychology, where higher-level processes in the brain are dominant. This is true for other perceptions of sound, such as music and noise. We shall not delve further into them; rather, we will concentrate on the question of loudness perception.
A unit called a phon is used to express loudness numerically. Phons differ from decibels because the phon is a unit of loudness perception, whereas the decibel is a unit of physical intensity. [link] shows the relationship of loudness to intensity (or intensity level) and frequency for persons with normal hearing. The curved lines are equal-loudness curves. Each curve is labeled with its loudness in phons. Any sound along a given curve will be perceived as equally loud by the average person. The curves were determined by having large numbers of people compare the loudness of sounds at different frequencies and sound intensity levels. At a frequency of 1000 Hz, phons are taken to be numerically equal to decibels. The following example helps illustrate how to use the graph:
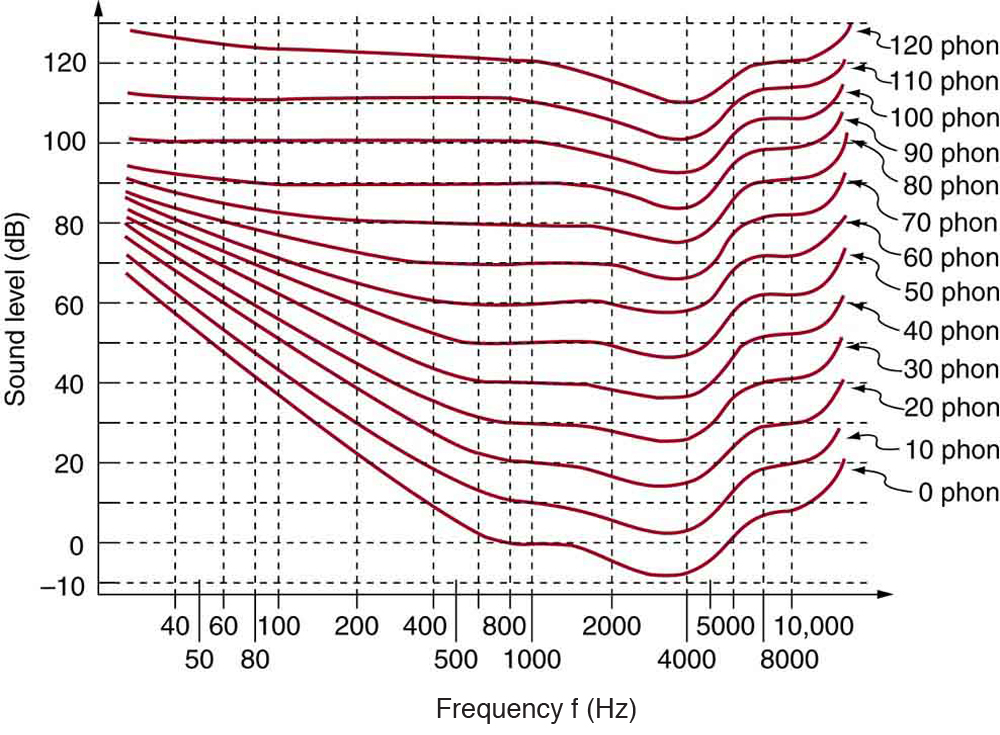
(a) What is the loudness in phons of a 100-Hz sound that has an intensity level of 80 dB? (b) What is the intensity level in decibels of a 4000-Hz sound having a loudness of 70 phons? (c) At what intensity level will an 8000-Hz sound have the same loudness as a 200-Hz sound at 60 dB?
Strategy for (a)
The graph in [link] should be referenced in order to solve this example. To find the loudness of a given sound, you must know its frequency and intensity level and locate that point on the square grid, then interpolate between loudness curves to get the loudness in phons.
Solution for (a)
(1) Identify knowns:
(2) Find the loudness: 75 phons.
Strategy for (b)
The graph in [link] should be referenced in order to solve this example. To find the intensity level of a sound, you must have its frequency and loudness. Once that point is located, the intensity level can be determined from the vertical axis.
Solution for (b)
(1) Identify knowns:
(2) Follow the 70-phon curve until it reaches 4000 Hz. At that point, it is below the 70 dB line at about 67 dB.
(3) Find the intensity level:
67 dB
Strategy for (c)
The graph in [link] should be referenced in order to solve this example.
Solution for (c)
(1) Locate the point for a 200 Hz and 60 dB sound.
(2) Find the loudness: This point lies just slightly above the 50-phon curve, and so its loudness is 51 phons.
(3) Look for the 51-phon level is at 8000 Hz: 63 dB.
Discussion
These answers, like all information extracted from [link] , have uncertainties of several phons or several decibels, partly due to difficulties in interpolation, but mostly related to uncertainties in the equal-loudness curves.
Notification Switch
Would you like to follow the 'Physics of the world around us' conversation and receive update notifications?

|
|

|
|

|
|

|
|

|
|

|
|

|
|

|
|

|
|
|
|