

| << Chapter < Page | Chapter >> Page > |
Even though this situation is not likely (knowing the population standard deviations is not likely), the followingexample illustrates hypothesis testing for independent means, known population standard deviations.The sampling distribution for the difference between the means is normal and both populations must be normal. The random variable is . The normal distribution has the following format:
independent groups, population standard deviations known: The mean lasting time of 2 competing floor waxes is to be compared. Twenty floors are randomly assigned to test each wax . Both populations have a normal distribution. The following table is the result.
| Wax | Sample Mean Number of Months Floor Wax Last | Population Standard Deviation |
|---|---|---|
| 1 | 3 | 0.33 |
| 2 | 2.9 | 0.36 |
Does the data indicate that wax 1 is more effective than wax 2 ? Test at a 5% level of significance.
This is a test of two independent groups, two population means, population standard deviations known.
Random Variable : difference in the mean number of months the competing floor waxes last.
The words "is more effective" says that wax 1 lasts longer than wax 2 , on the average. "Longer" is a symbol and goes into . Therefore, this is a right-tailed test.
Distribution for the test: The population standard deviations are known so the distribution is normal. Using the formula above, the distribution is:
Since then and the mean for the normal distributionis 0.
Calculate the p-value using the normal distribution: p-value = 0.1799
Graph:
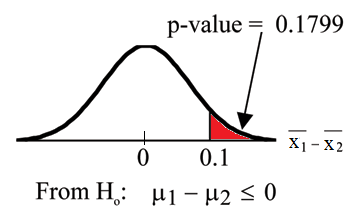
Compare α and the p-value: and p-value = 0.1799. Therefore, p-value.
Make a decision: Since p-value, do not reject .
Conclusion: At the 5% level of significance, from the sample data, there is not sufficient evidence to conclude that the mean time wax 1 lasts is longer (wax 1 is more effective) than the mean time wax 2 lasts.
STAT . Arrow over to
TESTS and press
3:2-SampZTest . Arrow over to
Stats and press
ENTER . Arrow down and
enter
.33 for sigma1,
.36 for sigma2,
3 for the first sample mean,
20 for n1,
2.9 for the second sample mean, and
20 for n2. Arrow down to
1: and arrow to>
2. Press
ENTER . Arrow down to
Calculate and press
ENTER . The
p-value is p = 0.1799 and the test statistic is 0.9157. Do the procedure againbut instead of
Calculate do
Draw .Notification Switch
Would you like to follow the 'Collaborative statistics' conversation and receive update notifications?

|
|

|
|

|
|

|
|

|
|

|
|

|
|

|
|
|
|
|

|