Is the mean of the Final Exam scores of the online class lower than the mean of the Final Exam scores of the face-to-face class? Test at a 5% significance level. Answer the following questions:
Is this a test of two means or two proportions?
Are the population standard deviations known or unknown?
Which distribution do you use to perform the test?
What is the random variable?
What are the null and alternative hypotheses? Write the null and alternative hypotheses in words and in symbols.
Is this test right, left, or two tailed?
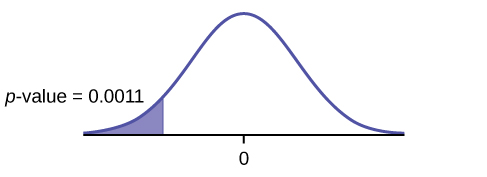
What is the
p -value?
Do you reject or not reject the null hypothesis?
At the ___ level of significance, from the sample data, there ______ (is/is not) sufficient evidence to conclude that ______.
(See the conclusion in
[link] , and write yours in a similar fashion)
First put the data for each group into two lists (such as L1 and L2). Press STAT. Arrow over to TESTS and press 4:2SampTTest. Make sure Data is highlighted and press ENTER. Arrow down and enter L1 for the first list and L2 for the second list. Arrow down to
μ1 : and arrow to ≠
μ2 (does not equal). Press ENTER. Arrow down to Pooled: No. Press ENTER. Arrow down to Calculate and press ENTER.
Note
Be careful not to mix up the information for Group 1 and Group 2!
two means
unknown
Student's
t
H
0 :
μ
1 =
μ
2 Null hypothesis: the means of the final exam scores are equal for the online and face-to-face statistics classes.
H
a :
μ
1 <
μ
2 Alternative hypothesis: the mean of the final exam scores of the online class is less than the mean of the final exam scores of the face-to-face class.
left-tailed
p -value = 0.0011
Reject the null hypothesis
The professor was correct. The evidence shows that the mean of the final exam scores for the online class is lower than that of the face-to-face class.
At the
5% level of significance, from the sample data, there is (is/is not) sufficient evidence to conclude that the mean of the final exam scores for the online class is less than
the mean of final exam scores of the face-to-face class.
Cohen's standards for small, medium, and large effect sizes
Cohen's
d is a measure of effect size based on the differences between two means. Cohen’s
d , named for United States statistician Jacob Cohen, measures the relative strength of the differences between the means of two populations based on sample data. The calculated value of effect size is then compared to Cohen’s standards of small, medium, and large effect sizes.
Cohen's standard effect sizes
Size of effect
d
Small
0.2
medium
0.5
Large
0.8
Cohen's
d is the measure of the difference between two means divided by the pooled standard deviation:
where
Calculate Cohen’s
d for
[link] . Is the size of the effect small, medium, or large? Explain what the size of the effect means for this problem.
μ1 = 4
s1 = 1.5
n1 = 11
μ2 = 3.5
s2 = 1
n2 = 9
d = 0.384
The effect is small because 0.384 is between Cohen’s value of 0.2 for small effect size and 0.5 for medium effect size. The size of the differences of the means for the two colleges is small indicating that there is not a significant difference between them.