

| << Chapter < Page | Chapter >> Page > |
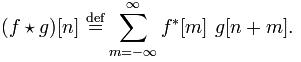
Template matching involves comparing regions of an image to a template, using correlation algorithms to detect regions that are similar. Correlation is similar to convolution but without flipping one of the signals. For use in image processing, we must normalize the signals to account for variations of intensity in the image matrices, one for each color matrix (red, green, and blue). Using the MATLAB function normxcorr2 , we are able to take a normalized 2-D cross-correlation of two images, with the regions most similar to the template in the picture returning the highest correlation values.
Examining a cross-correlation formula we see the similarity to convolution except neither image is flipped:
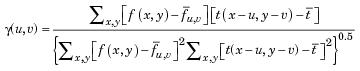
In order to expand to two dimensions and normalize the correlation, we must use linear algebra. Since MATLAB allows us to convert images to 2-D matrices, three for a color image (the RGB values at each x,y coordinate pair), we can run a similar formula but use vectors instead of points. The normalization factor on the bottom scales the values so they do not vary based on the high intensities of individual colors in parts of the image. Without this correction, a bright sky would always have high correlation with the image just because it is bright.
Thus, using a stop sign template we can attempt to match it with an image and extract the location of highest correlation. At this point, we can either check it against a threshold value to determine if it matches, or do further analysis on regions of the image.
Edge detection involves analyzing changes in intensity to determine the edges in an image, and then further analysis can be performed on certain bounded regions of the image. Given an colored image, MATLAB has the capability to convert it to a 2-D grayscale image using rgb2gray . Then, we can capitalize on the changes in intensity to detect edges. The MATLAB algorithm we chose to accomplish this is the Sobel method, which approximated the gradient of the image using a convolution with the following matrices.
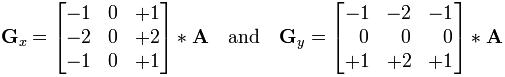
The regions with the highest changes in intensity are the most likely to be edges in an image. Given the probable edges, we can use the function bwareaopen to remove any bounded regions that are too small to be of use in our image processing. Left with only large boundaries, we can now test each one for various features such as color, shape, area, etc. to determine if it is a street sign.
Notification Switch
Would you like to follow the 'Elec 301 projects fall 2011' conversation and receive update notifications?

|
|

|
|

|
|

|
|
|
|
|

|
|
|
|
|

|
|

|
|

|