<< Chapter < Page Chapter >> Page >

The program named ForLoop02

This program is an upgrade of the program named ForLoop01 . The behavior of this program is the same as the earlier program with the followingexceptions:

  • A slider variable named numberLoops is placed in the upper left corner of the Stage as shown in Image H .
  • When the user clicks the green flag, orthogonal axes are drawn through the origin of the Stage and the cat is placed at the origin.
  • When the user clicks the cat, the number of times the code in the repeat block is executed is determined by the current value of the slider variable.
  • As the code in the repeat block is repetitively executed, the path of the cat is traced out on the Stage as a series of short straightline segments, producing the circular path shown in Image I .

Image h. program forloop02 output after clicking the green flag.

Missing image.
Image H. Program ForLoop02 output after clicking the green flag.

Image i. program forloop02 output after clicking the cat.

Missing image.
Image I. Program ForLoop02 output after clicking the cat.

The program code

The code for this program is shown in Image J .

Image j. program code for the program named forloop02.

Missing image.
Image J. Program code for the program named ForLoop02.

Create a variable

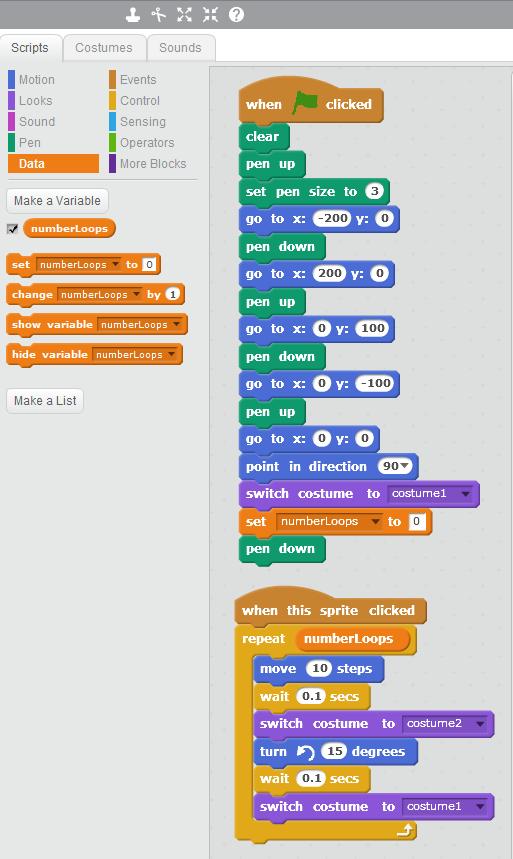
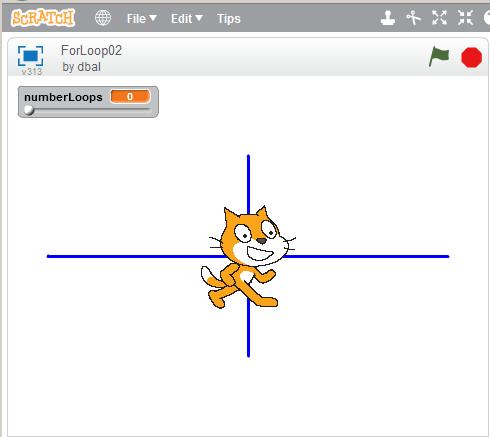
The code in the left panel in Image J creates a variable with a slider named numberLoops and causes it to be displayed on the Stage as shown in Image I .

The initialization code

Although there is quite a lot of code that is executed when the green flag is clicked, there is nothing new there. All of that code has been explained in thisor earlier modules. For review, the green pen blocks and the blue go to blocks are used together to draw the Cartesian coordinates. Note that the pen is down when the initialization code finishes executing. As a result, a line willbe drawn whenever the cat sprite moves.

The repeat block

The only thing that is really new to this program is the use of the variable block named numberLoops to specify the number of times that the code in the repeat block will be executed each time the cat is clicked. Otherwise the code in the repeat block in Image J is the same as the code in the repeat block shown in Image F .

The operational difference

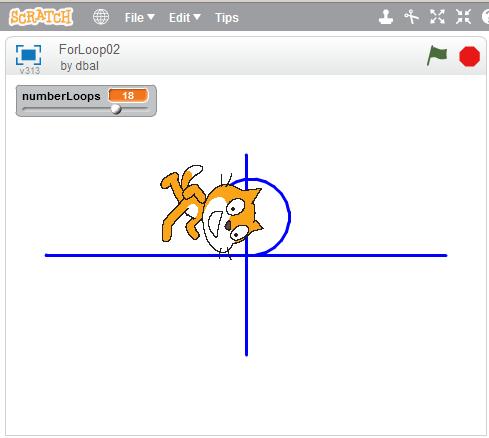
The operational difference is that each time the repeat block in Image F is executed, the code inside the repeat block will be executed 24 times. Each time the repeat block in Image J is executed, the number of times that the code inside the repeat block will be executed is specified by thecurrent position of the slider in Image I . This, in effect converts the static program named ForLoop01 into an interactive program in which the user has some control over the program behavior at runtime.

As mentioned earlier, because the pen is down, a line is drawn each time the cat sprite moves. That is what draws the circular path shown in Image I .

Online versions of these programs are available

Copies of these two programs have been posted online for your review (see Resources for the URL) . If you don't find the programs using that URL, search the Scratch site for the usernamed dbal.

Questions & Answers

differentiate between demand and supply giving examples
Lambiv Reply
differentiated between demand and supply using examples
Lambiv
what is labour ?
Lambiv
how will I do?
Venny Reply
how is the graph works?I don't fully understand
Rezat Reply
information
Eliyee
devaluation
Eliyee
t
WARKISA
hi guys good evening to all
Lambiv
multiple choice question
Aster Reply
appreciation
Eliyee
explain perfect market
Lindiwe Reply
In economics, a perfect market refers to a theoretical construct where all participants have perfect information, goods are homogenous, there are no barriers to entry or exit, and prices are determined solely by supply and demand. It's an idealized model used for analysis,
Ezea
What is ceteris paribus?
Shukri Reply
other things being equal
AI-Robot
When MP₁ becomes negative, TP start to decline. Extuples Suppose that the short-run production function of certain cut-flower firm is given by: Q=4KL-0.6K2 - 0.112 • Where is quantity of cut flower produced, I is labour input and K is fixed capital input (K-5). Determine the average product of lab
Kelo
Extuples Suppose that the short-run production function of certain cut-flower firm is given by: Q=4KL-0.6K2 - 0.112 • Where is quantity of cut flower produced, I is labour input and K is fixed capital input (K-5). Determine the average product of labour (APL) and marginal product of labour (MPL)
Kelo
yes,thank you
Shukri
Can I ask you other question?
Shukri
what is monopoly mean?
Habtamu Reply
What is different between quantity demand and demand?
Shukri Reply
Quantity demanded refers to the specific amount of a good or service that consumers are willing and able to purchase at a give price and within a specific time period. Demand, on the other hand, is a broader concept that encompasses the entire relationship between price and quantity demanded
Ezea
ok
Shukri
how do you save a country economic situation when it's falling apart
Lilia Reply
what is the difference between economic growth and development
Fiker Reply
Economic growth as an increase in the production and consumption of goods and services within an economy.but Economic development as a broader concept that encompasses not only economic growth but also social & human well being.
Shukri
production function means
Jabir
What do you think is more important to focus on when considering inequality ?
Abdisa Reply
any question about economics?
Awais Reply
sir...I just want to ask one question... Define the term contract curve? if you are free please help me to find this answer 🙏
Asui
it is a curve that we get after connecting the pareto optimal combinations of two consumers after their mutually beneficial trade offs
Awais
thank you so much 👍 sir
Asui
In economics, the contract curve refers to the set of points in an Edgeworth box diagram where both parties involved in a trade cannot be made better off without making one of them worse off. It represents the Pareto efficient allocations of goods between two individuals or entities, where neither p
Cornelius
In economics, the contract curve refers to the set of points in an Edgeworth box diagram where both parties involved in a trade cannot be made better off without making one of them worse off. It represents the Pareto efficient allocations of goods between two individuals or entities,
Cornelius
Suppose a consumer consuming two commodities X and Y has The following utility function u=X0.4 Y0.6. If the price of the X and Y are 2 and 3 respectively and income Constraint is birr 50. A,Calculate quantities of x and y which maximize utility. B,Calculate value of Lagrange multiplier. C,Calculate quantities of X and Y consumed with a given price. D,alculate optimum level of output .
Feyisa Reply
Answer
Feyisa
c
Jabir
the market for lemon has 10 potential consumers, each having an individual demand curve p=101-10Qi, where p is price in dollar's per cup and Qi is the number of cups demanded per week by the i th consumer.Find the market demand curve using algebra. Draw an individual demand curve and the market dema
Gsbwnw Reply
suppose the production function is given by ( L, K)=L¼K¾.assuming capital is fixed find APL and MPL. consider the following short run production function:Q=6L²-0.4L³ a) find the value of L that maximizes output b)find the value of L that maximizes marginal product
Abdureman
types of unemployment
Yomi Reply
What is the difference between perfect competition and monopolistic competition?
Mohammed
Got questions? Join the online conversation and get instant answers!
Jobilize.com Reply

Get Jobilize Job Search Mobile App in your pocket Now!

Get it on Google Play Download on the App Store Now


Source:  OpenStax, Teaching beginners to code. OpenStax CNX. May 27, 2013 Download for free at http://cnx.org/content/col11498/1.20
Google Play and the Google Play logo are trademarks of Google Inc.

Notification Switch

Would you like to follow the 'Teaching beginners to code' conversation and receive update notifications?

Ask