

| << Chapter < Page | Chapter >> Page > |
Given a tabular function, create a new row to represent a vertical shift.
A function is given in [link] . Create a table for the function
| 2 | 4 | 6 | 8 | |
| 1 | 3 | 7 | 11 |
The formula tells us that we can find the output values of by subtracting 3 from the output values of For example:
Subtracting 3 from each value, we can complete a table of values for as shown in [link] .
| 2 | 4 | 6 | 8 | |
| 1 | 3 | 7 | 11 | |
| −2 | 0 | 4 | 8 |
The function gives the height of a ball (in meters) thrown upward from the ground after seconds. Suppose the ball was instead thrown from the top of a 10-m building. Relate this new height function to and then find a formula for
We just saw that the vertical shift is a change to the output, or outside, of the function. We will now look at how changes to input, on the inside of the function, change its graph and meaning. A shift to the input results in a movement of the graph of the function left or right in what is known as a horizontal shift , shown in [link] .
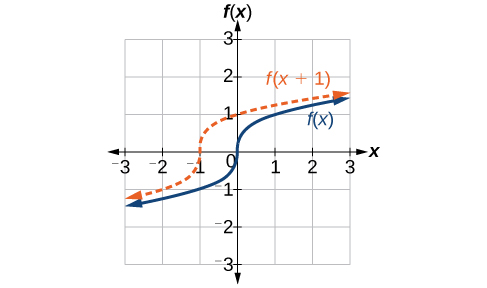
For example, if then is a new function. Each input is reduced by 2 prior to squaring the function. The result is that the graph is shifted 2 units to the right, because we would need to increase the prior input by 2 units to yield the same output value as given in
Given a function a new function where is a constant, is a horizontal shift of the function If is positive, the graph will shift right. If is negative, the graph will shift left.
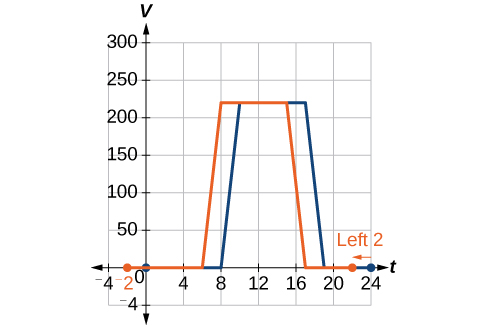
Returning to our building airflow example from [link] , suppose that in autumn the facilities manager decides that the original venting plan starts too late, and wants to begin the entire venting program 2 hours earlier. Sketch a graph of the new function.
We can set to be the original program and to be the revised program.
In the new graph, at each time, the airflow is the same as the original function was 2 hours later. For example, in the original function the airflow starts to change at 8 a.m., whereas for the function the airflow starts to change at 6 a.m. The comparable function values are See [link] . Notice also that the vents first opened to at 10 a.m. under the original plan, while under the new plan the vents reach at 8 a.m., so
In both cases, we see that, because starts 2 hours sooner, That means that the same output values are reached when
Notification Switch
Would you like to follow the 'Essential precalculus, part 1' conversation and receive update notifications?

|
|

|
|

|
|

|
|

|
|

|
|

|
|
|
|
|

|
|

|