

| << Chapter < Page | Chapter >> Page > |
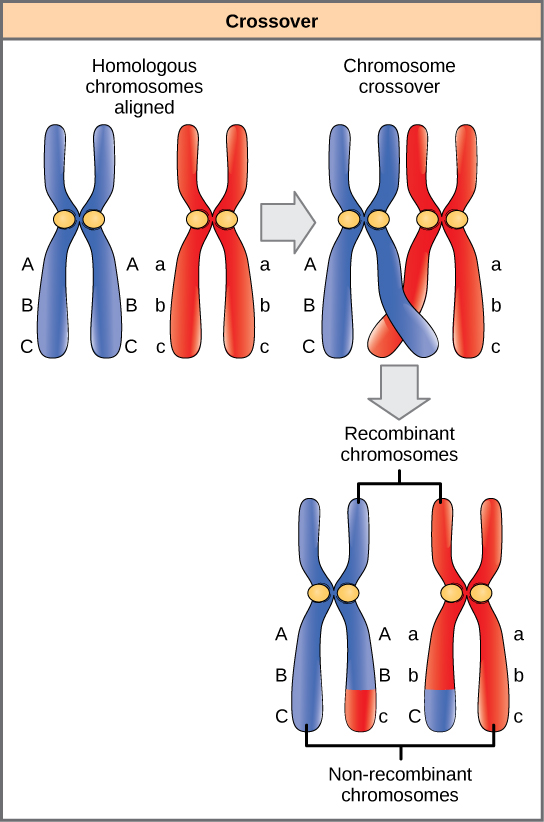
When two genes are located in close proximity on the same chromosome, they are considered linked, and their alleles tend to be transmitted through meiosis together. To exemplify this, imagine a dihybrid cross involving flower color and plant height in which the genes are next to each other on the chromosome. If one homologous chromosome has alleles for tall plants and red flowers, and the other chromosome has genes for short plants and yellow flowers, then when the gametes are formed, the tall and red alleles will go together into a gamete and the short and yellow alleles will go into other gametes. These are called the parental genotypes because they have been inherited intact from the parents of the individual producing gametes. But unlike if the genes were on different chromosomes, there will be no gametes with tall and yellow alleles and no gametes with short and red alleles. If you create the Punnett square with these gametes, you will see that the classical Mendelian prediction of a 9:3:3:1 outcome of a dihybrid cross would not apply. As the distance between two genes increases, the probability of one or more crossovers between them increases, and the genes behave more like they are on separate chromosomes. Geneticists have used the proportion of recombinant gametes (the ones not like the parents) as a measure of how far apart genes are on a chromosome. Using this information, they have constructed elaborate maps of genes on chromosomes for well-studied organisms, including humans.
Mendel’s seminal publication makes no mention of linkage, and many researchers have questioned whether he encountered linkage but chose not to publish those crosses out of concern that they would invalidate his independent assortment postulate. The garden pea has seven chromosomes, and some have suggested that his choice of seven characteristics was not a coincidence. However, even if the genes he examined were not located on separate chromosomes, it is possible that he simply did not observe linkage because of the extensive shuffling effects of recombination.
Question : What will be the offspring of a dihybrid cross?
Background : Consider that pea plants mature in one growing season, and you have access to a large garden in which you can cultivate thousands of pea plants. There are several true-breeding plants with the following pairs of traits: tall plants with inflated pods, and dwarf plants with constricted pods. Before the plants have matured, you remove the pollen-producing organs from the tall/inflated plants in your crosses to prevent self-fertilization. Upon plant maturation, the plants are manually crossed by transferring pollen from the dwarf/constricted plants to the stigmata of the tall/inflated plants.
Hypothesis : Both trait pairs will sort independently according to Mendelian laws. When the true-breeding parents are crossed, all of the F 1 offspring are tall and have inflated pods, which indicates that the tall and inflated traits are dominant over the dwarf and constricted traits, respectively. A self-cross of the F 1 heterozygotes results in 2,000 F 2 progeny.
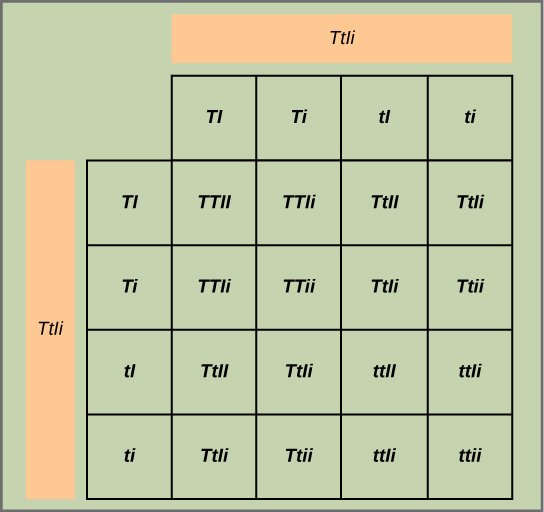
Test the hypothesis : Because each trait pair sorts independently, the ratios of tall:dwarf and inflated:constricted are each expected to be 3:1. The tall/dwarf trait pair is called T/t , and the inflated/constricted trait pair is designated I/i . Each member of the F 1 generation therefore has a genotype of TtIi . Construct a grid analogous to [link] , in which you cross two TtIi individuals. Each individual can donate four combinations of two traits: TI , Ti , tI , or ti , meaning that there are 16 possibilities of offspring genotypes. Because the T and I alleles are dominant, any individual having one or two of those alleles will express the tall or inflated phenotypes, respectively, regardless if they also have a t or i allele. Only individuals that are tt or ii will express the dwarf and constricted alleles, respectively. As shown in [link] , you predict that you will observe the following offspring proportions: tall/inflated:tall/constricted:dwarf/inflated:dwarf/constricted in a 9:3:3:1 ratio. Notice from the grid that when considering the tall/dwarf and inflated/constricted trait pairs in isolation, they are each inherited in 3:1 ratios.
Test the hypothesis : You cross the dwarf and tall plants and then self-cross the offspring. For best results, this is repeated with hundreds or even thousands of pea plants. What special precautions should be taken in the crosses and in growing the plants?
Analyze your data : You observe the following plant phenotypes in the F 2 generation: 2706 tall/inflated, 930 tall/constricted, 888 dwarf/inflated, and 300 dwarf/constricted. Reduce these findings to a ratio and determine if they are consistent with Mendelian laws.
Form a conclusion : Were the results close to the expected 9:3:3:1 phenotypic ratio? Do the results support the prediction? What might be observed if far fewer plants were used, given that alleles segregate randomly into gametes? Try to imagine growing that many pea plants, and consider the potential for experimental error. For instance, what would happen if it was extremely windy one day?
Notification Switch
Would you like to follow the 'Open genetics' conversation and receive update notifications?

|
|

|
|

|
|

|
|

|
|

|
|

|
|

|
|

|
|

|