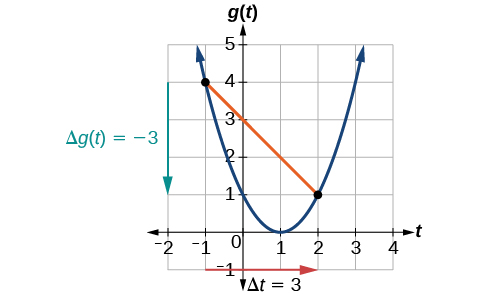
The horizontal change
is shown by the red arrow, and the vertical change
is shown by the turquoise arrow. The output changes by –3 while the input changes by 3, giving an average rate of change of
Computing average rate of change from a table
After picking up a friend who lives 10 miles away, Anna records her distance from home over time. The values are shown in
[link] . Find her average speed over the first 6 hours.
t (hours)
0
1
2
3
4
5
6
7
D (
t ) (miles)
10
55
90
153
214
240
282
300
Here, the average speed is the average rate of change. She traveled 282 miles in 6 hours, for an average speed of
The average speed is 47 miles per hour.
Computing average rate of change for a function expressed as a formula
Compute the average rate of change of
on the interval
We can start by computing the function values at each
endpoint of the interval.
Now we compute the average rate of change.
Find the average rate of change of
on the interval
Finding the average rate of change of a force
The
electrostatic force
measured in newtons, between two charged particles can be related to the distance between the particles
in centimeters, by the formula
Find the average rate of change of force if the distance between the particles is increased from 2 cm to 6 cm.
We are computing the average rate of change of
on the interval
The average rate of change is
newton per centimeter.
Finding an average rate of change as an expression
Find the average rate of change of
on the interval
The answer will be an expression involving
We use the average rate of change formula.
This result tells us the average rate of change in terms of
between
and any other point
For example, on the interval
the average rate of change would be
Questions & Answers
differentiate between demand and supply
giving examples
In economics, a perfect market refers to a theoretical construct where all participants have perfect information, goods are homogenous, there are no barriers to entry or exit, and prices are determined solely by supply and demand. It's an idealized model used for analysis,
When MP₁ becomes negative, TP start to decline.
Extuples Suppose that the short-run production function of certain cut-flower firm is given by: Q=4KL-0.6K2 - 0.112 •
Where is quantity of cut flower produced, I is labour input and K is fixed capital input (K-5). Determine the average product of lab
Kelo
Extuples Suppose that the short-run production function of certain cut-flower firm is given by: Q=4KL-0.6K2 - 0.112 •
Where is quantity of cut flower produced, I is labour input and K is fixed capital input (K-5). Determine the average product of labour (APL) and marginal product of labour (MPL)
Quantity demanded refers to the specific amount of a good or service that consumers are willing and able to purchase at a give price and within a specific time period. Demand, on the other hand, is a broader concept that encompasses the entire relationship between price and quantity demanded
Ezea
ok
Shukri
how do you save a country economic situation when it's falling apart
Economic growth as an increase in the production and consumption of goods and services within an economy.but
Economic development as a broader concept that encompasses not only economic growth but also social & human well being.
Shukri
production function means
Jabir
What do you think is more important to focus on when considering inequality ?
sir...I just want to ask one question... Define the term contract curve? if you are free please help me to find this answer 🙏
Asui
it is a curve that we get after connecting the pareto optimal combinations of two consumers after their mutually beneficial trade offs
Awais
thank you so much 👍 sir
Asui
In economics, the contract curve refers to the set of points in an Edgeworth box diagram where both parties involved in a trade cannot be made better off without making one of them worse off. It represents the Pareto efficient allocations of goods between two individuals or entities, where neither p
Cornelius
In economics, the contract curve refers to the set of points in an Edgeworth box diagram where both parties involved in a trade cannot be made better off without making one of them worse off. It represents the Pareto efficient allocations of goods between two individuals or entities,
Cornelius
Suppose a consumer consuming two commodities X and Y has
The following utility function u=X0.4 Y0.6. If the price of the X and Y are 2 and 3 respectively and income Constraint is birr 50.
A,Calculate quantities of x and y which maximize utility.
B,Calculate value of Lagrange multiplier.
C,Calculate quantities of X and Y consumed with a given price.
D,alculate optimum level of output .
the market for lemon has 10 potential consumers, each having an individual demand curve p=101-10Qi, where p is price in dollar's per cup and Qi is the number of cups demanded per week by the i th consumer.Find the market demand curve using algebra. Draw an individual demand curve and the market dema
suppose the production function is given by ( L, K)=L¼K¾.assuming capital is fixed find APL and MPL. consider the following short run production function:Q=6L²-0.4L³ a) find the value of L that maximizes output b)find the value of L that maximizes marginal product