

| << Chapter < Page | Chapter >> Page > |
21. a) Storm petrel en king penguin
c) I) 75 degrees
Il) 50 degrees
d) No. Can not survive in temperatures below freezing point.
22. x = 12; 3
x – 9 + 4: 0; -8; -12; -23
20. DID YOU KNOW?
Water freezes at 0°C and boils at 100°C. A Swedish astronomer discovered the Celsius scale. Examine the difference between the Celsius scale and the Fahrenheit scale.
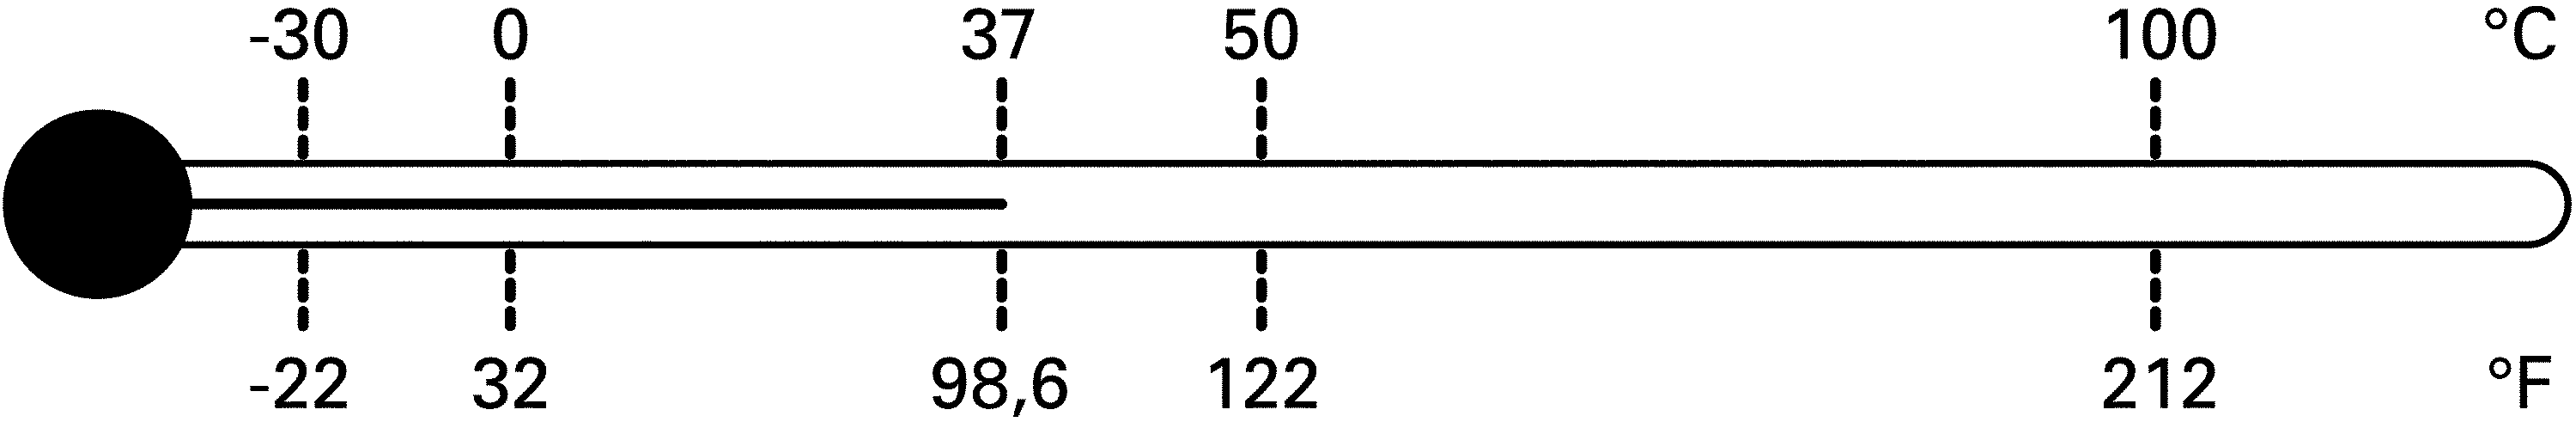
20.1 Fill in:<;>or = : -30 ........ -22
20.2 According to the thermometer on the previous page -30°C = -22°F. Explain how this is possible.
_____________________________________________________________________
_____________________________________________________________________
_____________________________________________________________________
_____________________________________________________________________
_____________________________________________________________________
_____________________________________________________________________
_____________________________________________________________________
_____________________________________________________________________
21. Look at the maximum and minimum temperatures that these living organisms are able to withstand. Then answer the questions that follow.

a) Who / what can survive at -60°C? ___________________________________
b) Can an earthworm survive temperatures below freezing point?
_____________________________________________________________________
c) What is the difference between the minimum and maximum temperatures at which the following living organisms can exist?
i) storm petrel ____________________________________________________
ii) housefly _______________________________________________________
iii) king penguin ___________________________________________________
d) Will a garden snail be able to survive in London in December?
_____________________________________________________________________
Motivate your answer.
_____________________________________________________________________
_____________________________________________________________________
_____________________________________________________________________
_____________________________________________________________________
e) Do you think that you will find many houseflies around the North Pole? _____________________________________________________________________
_____________________________________________________________________
_____________________________________________________________________
_____________________________________________________________________
Motivate your answer.
_____________________________________________________________________
_____________________________________________________________________
_____________________________________________________________________
_____________________________________________________________________
f) Take another look at the illustration. What is the sum of the minimum temperatures for all the organisms?
_____________________________________________________________________
_____________________________________________________________________
_____________________________________________________________________
_____________________________________________________________________
22. Can you complete the following table?
| x | 5 | –3 | –7 | –18 | ||
| x - 9 + 4 | 7 | –2 |
Learning Outcome 2: The learner will be able to recognise, describe and represent patterns and relationships, as well as to solve problems using algebraic language and skills.
Assessment Standard 2.1: We know this when the learner investigates and expands numeric and geometric patterns looking for a relationship or rules, including patterns;
Assessment Standard 2.6: We know this when the learner describes a situation by interpreting a graph of the situation, or draws a graph from a description of a situation (e.g. height of a roller-coaster car over time; the speed of a racing car going around a track).
Notification Switch
Would you like to follow the 'Mathematics grade 7' conversation and receive update notifications?

|
|

|
|

|
|

|
|

|
|

|
|

|
|

|
|

|
|

|