

| << Chapter < Page | Chapter >> Page > |
Listing 13 . Source code for the program named DotProb3D03.
/*DotProd3D03.java
Copyright 2008, R.G.BaldwinRevised 03/07/08

The purpose of this program is to demonstrate a practicaluse of the vector dot product - backface culling.

Study Kjell through Chapter 10, Angle between 3D Vectors.The program draws a 3D circular cylinder by stacking 20
circular disks on the x-z plane. The disks are centered onthe y-axis and are parallel to the x-z plane. The
thickness of each disk is 5 vertical units.Backface culling is done using the dot product between a
vector that is parallel to the viewpoint of the viewer anda vector that is perpendicular to the line being drawn to
form the outline of a disk.  The backface cullingprocess is good but not perfect.  There is some leakage
around the back on the right and left sides of thecylinder and some short lines segments are visible that
should not be visible.Tested using JDK 1.6 under WinXP.
*********************************************************/import java.awt.*;
import javax.swing.*;class DotProd3D03{
  public static void main(String[]args){
    GUI guiObj = new GUI();}//end main
}//end controlling class DotProd3D03//======================================================//

class GUI extends JFrame{//Specify the horizontal and vertical size of a JFrame
  // object.int hSize = 230;
  int vSize = 250;Image osi;//an off-screen image
  int osiWidth;//off-screen image widthint osiHeight;//off-screen image height
  MyCanvas myCanvas;//a subclass of CanvasGraphics2D g2D;//off-screen graphics context.
  //----------------------------------------------------//GUI(){//constructor//Set JFrame size, title, and close operation.
    setSize(hSize,vSize);setTitle("Copyright 2008,R.G.Baldwin");
    setDefaultCloseOperation(JFrame.EXIT_ON_CLOSE);//Create a new drawing canvas and add it to the// CENTER of the JFrame above the control panel.
    myCanvas = new MyCanvas();this.getContentPane().add(
                            BorderLayout.CENTER,myCanvas);//This object must be visible before you can get an
    // off-screen image.  It must also be visible before// you can compute the size of the canvas.
    setVisible(true);//Make the size of the off-screen image match the// size of the canvas.
    osiWidth = myCanvas.getWidth();osiHeight = myCanvas.getHeight();//Create an off-screen image and get a graphics
    // context on it.osi = createImage(osiWidth,osiHeight);
    g2D = (Graphics2D)(osi.getGraphics());//Call a method that sets the axes and draws the
    // cylinder.drawTheCylinder(g2D);

    //Cause the overridden paint method belonging to// myCanvas to be executed.
    myCanvas.repaint();}//end constructor//----------------------------------------------------////This method is used to set the axes to the center of// the off-screen image and to draw a 3D cylinder that
  // is centered on the y-axis.private void drawTheCylinder(Graphics2D g2D){

    //Translate the origin to the center of the off-screen// image.
    GM02.translate(g2D,0.5*osiWidth,-0.5*osiHeight);//Erase the screeng2D.setColor(Color.WHITE);
    GM02.fillRect(g2D,-osiWidth/2,osiHeight/2,osiWidth,osiHeight);

    //Get a vector that is approximately parallel to the// viewpoint of the viewer. The best values for this
    // vector were determined experimentally using this// program and the earlier program named DotProd3D02.
    GM02.Vector3D viewPoint =new GM02.Vector3D(new GM02.ColMatrix3D(43,5,50));//Draw a cylinder by stacking 20 circular disks on
    // the x-z plane. The disks are centered on the// y-axis and are parallel to the x-z plane. The
    // thickness of each disk is 5 vertical units.GM02.Point3D tempPointA;
    GM02.Point3D tempPointB;g2D.setColor(Color.BLACK);for(int y = 0;y<105;y += 5){//iterate on disks
      //Define the starting point on the circle for this// disk.
      tempPointA = new GM02.Point3D(new GM02.ColMatrix3D(76,y - osiHeight/4,0));
      //Iterate on points on the circle that represents// this disk.
      for(int cnt = 0;cnt<360;cnt++){//360 points
        //Compute the next point on the circle.tempPointB =
            new GM02.Point3D(new GM02.ColMatrix3D(76*Math.cos(Math.toRadians(cnt*360/360)),
              y - osiHeight/4,76*Math.sin(Math.toRadians(cnt*360/360))));//Do backface culling using the dot product of the
        // viewpoint vector and a vector that is almost// perpendicular to the line being drawn. If the
        // dot product is negative, or if the disk being// drawn is the top disk on the stack, draw the
        // line. Otherwise, don't draw the line.//The perpendicular vector used in the dot
        // product is the displacement vector from the// origin to a point that defines one end of the
        // line being drawn. Note that this vector is not// perfectly perpendicular to the line being
        // drawn. Later in the series, we will learn about// and use the cross product to get perpendicular
        // vectors.if((tempPointB.getDisplacementVector(
                           new GM02.Point3D(new GM02.ColMatrix3D(0,0,0)))
                                   .dot(viewPoint)<0.0)
                                           || (y == 100)){//Draw the line in 3D.
          new GM02.Line3D(tempPointA,tempPointB).draw(g2D);
        }//end if//Save the point for use in drawing the next line.
        tempPointA = tempPointB;}//end for loop on points
    }//end for loop on disks}//end drawTheCylinder method
  //====================================================////This is an inner class of the GUI class.
  class MyCanvas extends Canvas{//Override the paint() method. This method will be
    // called when the JFrame and the Canvas appear on the// screen or when the repaint method is called on the
    // Canvas object.//The purpose of this method is to display the
    // off-screen image on the screen.public void paint(Graphics g){
      g.drawImage(osi,0,0,this);}//end overridden paint()}//end inner class MyCanvas}//end class GUI
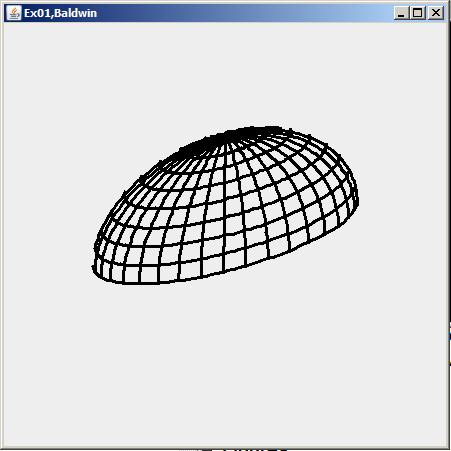
Using Java and the game-math library named GM02 , or using a different programming environment of your choice, write a program that createsthe drawing of half of a 3D sphere protruding upward from the x-z plane as shown in Figure 7 . The north and south poles of the sphere lie on the y-axis, but only thenorthern hemisphere is visible.
Cause your name to appear in the screen output in some manner.
Figure 7 - Output from Exercise 1.
Beginning with a program similar to the one that you wrote in Exercise 1 , create a drawing of a 3D sphere as shown in Figure 8 . The north and south poles of the sphere lie on the y-axis.
Figure 8 - Output from Exercise 2.

-end-
Notification Switch
Would you like to follow the 'Game 2302 - mathematical applications for game development' conversation and receive update notifications?

|
|

|
|

|
|

|
|
|
|
|

|
|

|
|

|
|

|
|
|
|