

| << Chapter < Page | Chapter >> Page > |
Wrapping Text: Sometimes the titles of columns or data entered in rows and columns is long and make the column extend beyond an inch or two. You can “wrap” the text so that all columns are about the same width if you like. Wrapping text is accomplished by (1) selecting (highlighting) by placing the cursor over the cell you want to have wrapped text, over the letter of the column you want to wrap text, or over the row number that you want to wrap text and then left clicking; and then (2) selecting the appropriate symbol from the ribbon in Excel and Google Spreadsheet by moving the cursor over that symbol and left clicking. Below is a picture of the symbols used in Excel and in Google Spreadsheet. Place your cursor over the symbol you want, left click on the symbol and the data cell you have selected will be wrapped. Below is also a picture of the label row (row 1) not wrapped (in Google Spreadsheet) followed by the labels wrapped (in Excel). Note that the first row has been wrapped and also column B. Note also that when the column is too narrow for numerical data, the pound symbol “#” will appear. If you make the column wider by placing your cursor in the line between the two letters of the columns or two numbers for rows a line with double arrows (pointing right and left for column width and up and down for row height) will appear. While you can see the line with double arrows left click and hold until the row or column is the right height or width. When you have the width or height to correctly display your data release your hold on the mouse and the new height or width will be displayed and held.

Non-wrapped text in the headings or row 1 of a google spreadsheet with the wrap test symbol highlighted in blue.
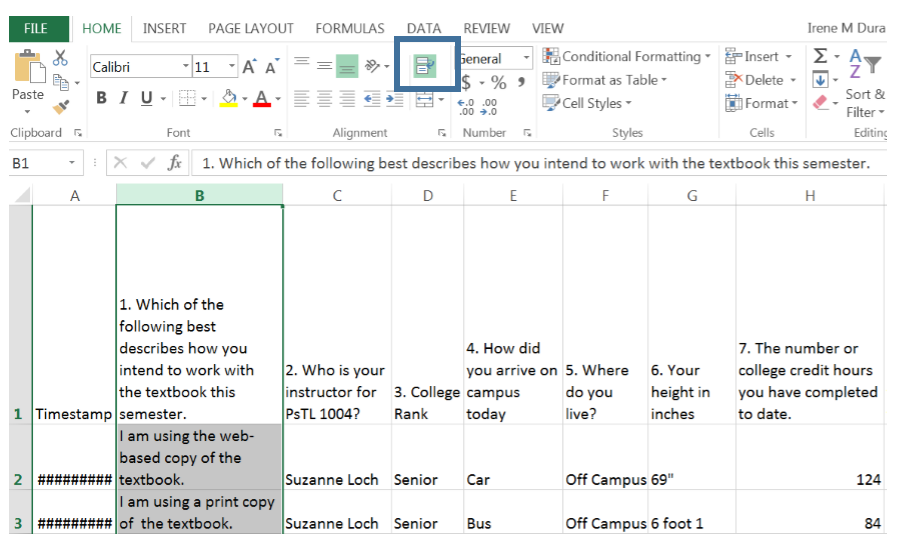
Wrapped text in the headers (row 1) and wrapped text in column B of a Excel spreadsheet. Note that the timestamp is indicated by a pound symbol in the Excel spreadsheet rather than in numeric characters as in the Google Spreadsheet. This indicated that the column is too narrow for proper display.
All other elements of displaying a spreadsheet can be done in a similar manner. You could use the same technique to center data, center column headings, right justify numeric data, change type or size of type, change number format.
Other Important functions of spreadsheets: Two other functions that would be good to present here are the formula function and the absolute value function. These two functions will be used throughout the semester. Any time you are indicating to the spreadsheet that you have a formula for the computer to compute you must start with an “=” equal sign . If you type in 1 + 1 into an empty spreadsheet cell, it will keep the 1 + 1 in that cell. If you type in =1+1 into an empty cell, it will produce 2. Try it, the main point here is a formula for the spreadsheet must start with an “=” equal sign. I could also pick the cell addresses of two or more cells and write =h2+h5 into an empty cell (for instance cell K2 on our sample spreadsheet, this would add the contents of cell h2 and h5. In our example spreadsheet that would add 124 + 95 which would equal 215.
Notification Switch
Would you like to follow the 'Collaborative statistics using spreadsheets' conversation and receive update notifications?

|
|

|
|

|
|

|
|

|
|

|
|
|
|
|

|
|
|
|
|

|