This module introduces the concept of statistics, specifically the ability to use statistics to describe data (descriptive statistics) as well as draw conclusions (inferential statistics). An optional classroom exercise is included.
The science of
statistics deals with the collection, analysis, interpretation, and presentation of
data . We see and use data in our everyday lives.
Optional collaborative classroom exercise
In your classroom, try this exercise. Have class members write down the average time (in hours, to the nearest half-hour) they sleep per night. Your instructor will record the data. Then create a simple graph (called a
dot plot ) of the data. A dot plot consists of a number line and dots (or points) positioned above the number line. For example, consider the following data:
5
5.5
6
6
6
6.5
6.5
6.5
6.5
7
7
8
8
9
The dot plot for this data would be as follows:
Frequency of average time (in hours) spent sleeping per night
image -->
Does your dot plot look the same as or different from the example? Why? If you did the same example in an English class with the same number of students, do you think the results would be the same? Why or why not?
Where do your data appear to cluster? How could you interpret the clustering?
The questions above ask you to analyze and interpret your data. With this example, you have begun your study of statistics.
In this course, you will learn how to organize and summarize data. Organizing and summarizing data is called
descriptive statistics . Two ways to summarize data are by graphing and by numbers (for example, finding an average). After you have studied probability and probability distributions, you will use formal methods for drawing conclusions from "good" data. The formal methods are called
inferential statistics . Statistical inference uses probability to determine how confident we can be that the conclusions are correct.
Effective interpretation of data (inference) is based on good procedures for producing data and thoughtful examination of the data. You will encounter what will seem to be too many mathematical formulas for interpreting data. The goal of statistics is not to perform numerous calculations using the formulas, but to gain an understanding of your data. The calculations can be done using a calculator or a computer. The understanding must come from you. If you can thoroughly grasp the basics of statistics, you can be more confident in the decisions you make in life.
Levels of measurement and statistical operations
The way a set of data is measured is called its level of measurement. Correct statistical procedures depend on a researcher being familiar with levels of measurement. Not every statistical operation can be used with every set of data.
Data can be classified into four levels of measurement. They are (from lowest to highest level):
Nominal scale level
Ordinal scale level
Interval scale level
Ratio scale level
Data that is measured using a
nominal scale is qualitative. Categories, colors, names, labels and favorite foods along with yes or no responses are examples of nominal level data. Nominal scale data are not ordered. For example, trying to classify people according to their favorite food does not make any sense. Putting pizza first and sushi second is not meaningful.
Smartphone companies are another example of nominal scale data. Some examples are Sony, Motorola, Nokia, Samsung and Apple. This is just a list and there is no agreed upon order. Some people may favor Apple but that is a matter of opinion. Nominal scale data cannot be used in calculations.
Data that is measured using an
ordinal scale is similar to nominal scale data but there is a big difference. The ordinal scale data can be ordered. An example of ordinal scale data is a list of the top five national parks in the United States. The top five national parks in the United States can be ranked from one to five but we cannot measure differences between the data.
Another example using the ordinal scale is a cruise survey where the responses to questions about the cruise are “excellent,” “good,” “satisfactory” and “unsatisfactory.” These responses are ordered from the most desired response by the cruise lines to the least desired. But the differences between two pieces of data cannot be measured. Like the nominal scale data, ordinal scale data cannot be used in calculations.
Data that is measured using the
interval scale is similar to ordinal level data because it has a definite ordering but there is a difference between data. The differences between interval scale data can be measured though the data does not have a starting point.
Temperature scales like Celsius (C) and Fahrenheit (F) are measured by using the interval scale. In both temperature measurements, 40 degrees is equal to 100 degrees minus 60 degrees. Differences make sense. But 0 degrees does not because, in both scales, 0 is not the absolute lowest temperature. Temperatures like
-10ᵒ F and -15ᵒ C exist and are colder than 0.
Interval level data can be used in calculations but one type of comparison cannot be done. Eighty degrees C is not 4 times as hot as 20ᵒ C (nor is 80ᵒ F 4 times as hot as 20ᵒ F). There is no meaning to the ratio of 80 to 20 (or 4 to 1).
Data that is measured using the
ratio scale takes care of the ratio problem and gives you the most information. Ratio scale data is like interval scale data but, in addition, it has a 0 point and ratios can be calculated. For example, four multiple choice statistics final exam scores are 80, 68, 20 and 92 (out of a possible 100 points). The exams were machine-graded.
The data can be put in order from lowest to highest: 20, 68, 80, 92.
The differences between the data have meaning. The score 92 is more than the score 68 by 24 points.
Ratios can be calculated. The smallest score for ratio data is 0. So 80 is 4 times 20. The score of 80 is 4 times better than the score of 20.
Exercises
What type of measure scale is being used? Nominal, Ordinal, Interval or Ratio.
High school men soccer players classified by their athletic ability: Superior, Average, Above average.
Baking temperatures for various main dishes: 350, 400, 325, 250, 300
The colors of crayons in a 24-crayon box.
Social security numbers.
Incomes measured in dollars
A satisfaction survey of a social website by number: 1 = very satisfied, 2 = somewhat satisfied, 3 = not satisfied.
Political outlook: extreme left, left-of-center, right-of-center, extreme right.
Time of day on an analog watch.
The distance in miles to the closest grocery store.
Three charges q_{1}=+3\mu C, q_{2}=+6\mu C and q_{3}=+8\mu C are located at (2,0)m (0,0)m and (0,3) coordinates respectively. Find the magnitude and direction acted upon q_{2} by the two other charges.Draw the correct graphical illustration of the problem above showing the direction of all forces.
To solve this problem, we need to first find the net force acting on charge q_{2}. The magnitude of the force exerted by q_{1} on q_{2} is given by F=\frac{kq_{1}q_{2}}{r^{2}} where k is the Coulomb constant, q_{1} and q_{2} are the charges of the particles, and r is the distance between them.
Muhammed
What is the direction and net electric force on q_{1}= 5µC located at (0,4)r due to charges q_{2}=7mu located at (0,0)m and q_{3}=3\mu C located at (4,0)m?
Capacitor is a separation of opposite charges using an insulator of very small dimension between them. Capacitor is used for allowing an AC (alternating current) to pass while a DC (direct current) is blocked.
Gautam
A motor travelling at 72km/m on sighting a stop sign applying the breaks such that under constant deaccelerate in the meters of 50 metres what is the magnitude of the accelerate
velocity can be 72 km/h in question. 72 km/h=20 m/s, v^2=2.a.x , 20^2=2.a.50, a=4 m/s^2.
Mehmet
A boat travels due east at a speed of 40meter per seconds across a river flowing due south at 30meter per seconds. what is the resultant speed of the boat
which has a higher temperature, 1cup of boiling water or 1teapot of boiling water which can transfer more heat 1cup of boiling water or 1 teapot of boiling water explain your . answer
I believe temperature being an intensive property does not change for any amount of boiling water whereas heat being an extensive property changes with amount/size of the system.
Someone
Scratch that
Someone
temperature for any amount of water to boil at ntp is 100⁰C (it is a state function and and intensive property) and it depends both will give same amount of heat because the surface available for heat transfer is greater in case of the kettle as well as the heat stored in it but if you talk.....
Someone
about the amount of heat stored in the system then in that case since the mass of water in the kettle is greater so more energy is required to raise the temperature b/c more molecules of water are present in the kettle
pratica A on solution of hydro chloric acid,B is a solution containing 0.5000 mole ofsodium chlorid per dm³,put A in the burret and titrate 20.00 or 25.00cm³ portion of B using melting orange as the indicator. record the deside of your burret tabulate the burret reading and calculate the average volume of acid used?
No. According to Isac Newtons law. this two bodies maybe you and the wall beside you.
Attracting depends on the mass och each body and distance between them.
Dlovan
Are you really asking if two bodies have to be charged to be influenced by Coulombs Law?
Specific heat capacity is a measure of the amount of energy required to raise the temperature of a substance by one degree Celsius (or Kelvin). It is measured in Joules per kilogram per degree Celsius (J/kg°C).
AI-Robot
specific heat capacity is the amount of energy needed to raise the temperature of a substance by one degree Celsius or kelvin
ROKEEB
Got questions? Join the online conversation and get instant answers!


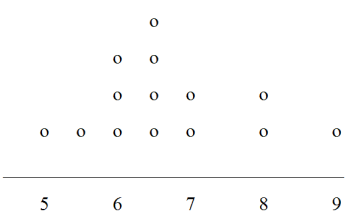 image -->