

| << Chapter < Page | Chapter >> Page > |
Suppose that one De Anza College employee is randomly selected.
Find P (the employee is an Administrator)
C
Find P (the employee is Faculty AND American Indian)
B
Find P (employee is Staff OR Hispanic)
D
Find P (employee is an Administrator GIVEN the employee is Black)
D
Being an Administrator and an American Indian are
A
P(X$gt; 4 or X<2) is best described by which of the following graphs?
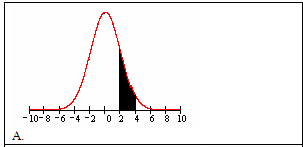
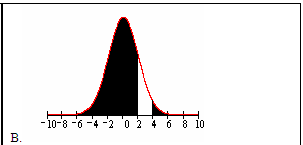
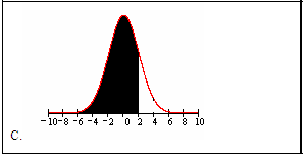
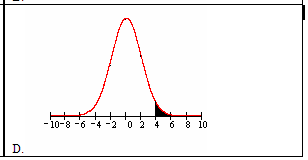
B
Questions 29 - 32 refer to the following: When a customer calls the "Help Line" at ABC Computer Software Co., the amount of time that a customer must wait "on hold" until somebody answers the line and helps the customer follows an exponential distribution with mean of 7.5 minutes.
What is the probability that a customer waits more than 10 minutes to receive help?
A
What is the 40th percentile of wait times for customers calling the help line?
B
The customer wait time that is 1 standard deviation above the mean is:
D
The probability that a customer calling the help line waits exactly 6 minutes for help:
A
Questions 33 – 35 refer to the following: ABC Delivery Service offers next day delivery of packages weighing between 2 and 20 pounds in a certain city. The have found that the weights of the packages they deliver are uniformly distributed between 2 and 20 pounds.
What is the probability that a package weighs between 10 and 15 pounds?
A
Given that a package weighs less than 10 pounds, what is the probability that it weighs less than 5 pounds?
C
35% of packages weigh less than how many pounds?
B
Suppose that the probability that an adult in California will watch a Giant’s World Series game is 65%. Each person is considered independent. Of interest, is the number of adults in California we must survey until we find one who will watch a Giant’s World Series game. What is the probability that you must ask 2 or 3 people? (This is a geometric problem. If you did not cover the geometric distribution, then skip this problem.)
B
Questions 37– 39 refer to the following: The amount of time De Anza students work per week is approximately normally distributed with mean of 18.17 hours and a standard deviation of 12.92 hours.
The 90th percentile for the amount of time De Anza students work per week is:
D
Which of the following is NOT TRUE about the normal distribution?
B
We use the z-score to:
A
Notification Switch
Would you like to follow the 'Collaborative statistics: supplemental course materials' conversation and receive update notifications?

|
|

|
|

|
|

|
|

|
|

|
|

|
|

|
|

|
|

|