<< Chapter < Page Chapter >> Page >

Inleiding

In Graad 10 het ons die idee van gemiddelde gradiënt ondersoek and gesien dat die gradiënt van sommige funksies verskillend is by verskillende intervalle. In Graad 11 kyk ons verder na die idee van gemiddelde gradiënt, en stel die idee van 'n gradiënt van 'n kurwe by 'n punt bekend.

Gemiddelde gradiënt

Ons het gesien dat die gemiddelde gradiënt tussen twee punte op 'n kurwe die gradiënt is van die reguitlyn wat deur twee punte gaan.

The gemiddelde gradiënt tussen twee punte op 'n kurwe is die gradiënt van die reguitlyn wat deur die twee punte gaan.

Wat gebeur met die gradiënt as ons die posisie van een punt vasstel en die tweede punt nader aan die vaste punt beweeg?
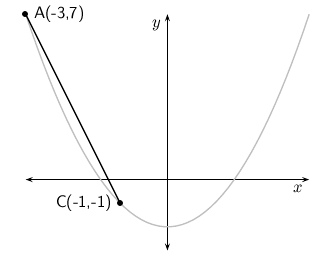
Ondersoek: gradiënt by 'n enkele punt op 'n kurwe

Die kurwe gewys is gedefineër deur y = - 2 x 2 - 5 . Punt B is vasgestel by koördinate (0, -5). Die posisie van punt A wissel. Voltooi die tabel hieronder deur die y -koördinate van punt A te bereken vir die gegewe x -koördinate. Bereken dan die gemiddelde gradiënt tussen punte A en B.

x A y A gemiddelde gradiënt
-2
-1.5
-1
-0.5
0
0.5
1
1.5
2

Wat gebeur met die gemiddelde gradiënt soos A in die rigting van B beweeg? Wat gebreur met die gemiddelde gradieënt soos A wegbeweeg van B?Wat is die gemiddelde gradiënt wanneer A oorvleuel met B?

In [link] verander die gradiënt van die reguitlyn wat deur punte A en C gaan soos A nader beweeg aan C. By die punt wat A en C oorvleuel gaan die reguitlyn slegs deur een punt op die kurwe. So 'n lyn is bekend as 'n raaklyn aan die kurwe.

Die gradiënt van die reguitlyn tussen A en C verander soos die punt A between langs die kurwe na C toe. Daar kom 'n punt wat A en C oorvleuel (soos gewys in (c)). By daardie punt is die lyn 'n raaklyn aan die kurwe.

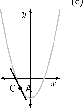
Ons stel dan die idee bekend van 'n gradiënt by 'n enkele punt op 'n kurwe. Die gradiënt by 'n punt op 'n kurwe is eenvoudig die gradiënt van die raaklyn aan die kurwe by die gegewe punt.

Kry die gemiddelde gradiënt tussen twee punte P ( a ; g ( a ) ) en Q ( a + h ; g ( a + h ) ) op die kurwe g ( x ) = x 2 . Kry dan die gemiddelde gradiënt tussen P ( 2 ; g ( 2 ) ) en Q ( 4 ; g ( 4 ) ) . Laastens, verduidelik wat gebeur met die gemiddelde gradiënt soos P nader beweeg aan Q.

  1. x 1 = a
    x 2 = a + h
  2. Deur die funksie g ( x ) = x 2 te gebruik, kry ons:

    y 1 = g ( a ) = a 2
    y 2 = g ( a + h ) = ( a + h ) 2 = a 2 + 2 a h + h 2
  3. y 2 - y 1 x 2 - x 1 = ( a 2 + 2 a h + h 2 ) - ( a 2 ) ( a + h ) - ( a ) = a 2 + 2 a h + h 2 - a 2 a + h - a = 2 a h + h 2 h = h ( 2 a + h ) h = 2 a + h

    Die gemiddelde gradiënt tussen P ( a ; g ( a ) ) en Q ( a + h ; g ( a + h ) ) op die kurwe g ( x ) = x 2 is 2 a + h .

  4. Ons kan die resultaat in [link] gebruik, maar ons sal moet bepaal wat a en h is. Ons doen dit deur te kyk na die definisies van P en Q. Die x -koërdinaat van P is a en die x -koördinaat van Q is a + h . Daarom as ons aanneem dat a = 2 en a + h = 4 , dan is h = 2 .

    Dan is die gemiddelde gradiënt

    2 a + h = 2 ( 2 ) + ( 2 ) = 6
  5. soos punt P nader beweeg aan punt Q, word h kleiner. Dit beteken dat die gemiddelde gradiënt ook kleiner word. As die punt Q oorvleuel met die punt P, is h = 0 en die gemiddelde gradiënt word gegee deur 2 a .

Ons sien nou dat ons die vergelyking kan skryf om die gemiddelde gradiënt op 'n effens anderse manier te bereken. As ons 'n kurwe het gedefineer deur f ( x ) , dan vir twee punte P en Q met P ( a ; f ( a ) ) en Q ( a + h ; f ( a + h ) ) , word die gemiddelde gradiënt tussen P en Q gegee deur f ( x ) :

y 2 - y 1 x 2 - x 1 = f ( a + h ) - f ( a ) ( a + h ) - ( a ) = f ( a + h ) - f ( a ) h

Hierdie resultaat is belangrik om die gradiënt te bereken by 'n punt op 'n kurwe en dit sal in groter detail ondersoek word in Graad 12.

Hoofstukoefeninge

    1. Bepaal die gemiddelde gradiënt van die kurwe f ( x ) = x ( x + 3 ) tussen x =  – 5 en x =  – 3 .
    2. Sê nou wat jy kan aflei oor die funksie f tussen x =  – 5 en x =  – 3 .
  1. A(1;3) is 'n punt op f ( x ) = 3 x 2 .
    1. Bepaal die gradiënt van die kurwe by punt A.
    2. Bepaal nou die vergelyking van die raaklyn by A.
  2. Given: f ( x ) = 2 x 2 .
    1. Bepaal die gemiddelde gradiënt tussen x = - 2 en x = 1 .
    2. Bepaal die gradiënt van die kurwe van f waar x = 2 .

Questions & Answers

differentiate between demand and supply giving examples
Lambiv Reply
differentiated between demand and supply using examples
Lambiv
what is labour ?
Lambiv
how will I do?
Venny Reply
how is the graph works?I don't fully understand
Rezat Reply
information
Eliyee
devaluation
Eliyee
t
WARKISA
hi guys good evening to all
Lambiv
multiple choice question
Aster Reply
appreciation
Eliyee
explain perfect market
Lindiwe Reply
In economics, a perfect market refers to a theoretical construct where all participants have perfect information, goods are homogenous, there are no barriers to entry or exit, and prices are determined solely by supply and demand. It's an idealized model used for analysis,
Ezea
What is ceteris paribus?
Shukri Reply
other things being equal
AI-Robot
When MP₁ becomes negative, TP start to decline. Extuples Suppose that the short-run production function of certain cut-flower firm is given by: Q=4KL-0.6K2 - 0.112 • Where is quantity of cut flower produced, I is labour input and K is fixed capital input (K-5). Determine the average product of lab
Kelo
Extuples Suppose that the short-run production function of certain cut-flower firm is given by: Q=4KL-0.6K2 - 0.112 • Where is quantity of cut flower produced, I is labour input and K is fixed capital input (K-5). Determine the average product of labour (APL) and marginal product of labour (MPL)
Kelo
yes,thank you
Shukri
Can I ask you other question?
Shukri
what is monopoly mean?
Habtamu Reply
What is different between quantity demand and demand?
Shukri Reply
Quantity demanded refers to the specific amount of a good or service that consumers are willing and able to purchase at a give price and within a specific time period. Demand, on the other hand, is a broader concept that encompasses the entire relationship between price and quantity demanded
Ezea
ok
Shukri
how do you save a country economic situation when it's falling apart
Lilia Reply
what is the difference between economic growth and development
Fiker Reply
Economic growth as an increase in the production and consumption of goods and services within an economy.but Economic development as a broader concept that encompasses not only economic growth but also social & human well being.
Shukri
production function means
Jabir
What do you think is more important to focus on when considering inequality ?
Abdisa Reply
any question about economics?
Awais Reply
sir...I just want to ask one question... Define the term contract curve? if you are free please help me to find this answer 🙏
Asui
it is a curve that we get after connecting the pareto optimal combinations of two consumers after their mutually beneficial trade offs
Awais
thank you so much 👍 sir
Asui
In economics, the contract curve refers to the set of points in an Edgeworth box diagram where both parties involved in a trade cannot be made better off without making one of them worse off. It represents the Pareto efficient allocations of goods between two individuals or entities, where neither p
Cornelius
In economics, the contract curve refers to the set of points in an Edgeworth box diagram where both parties involved in a trade cannot be made better off without making one of them worse off. It represents the Pareto efficient allocations of goods between two individuals or entities,
Cornelius
Suppose a consumer consuming two commodities X and Y has The following utility function u=X0.4 Y0.6. If the price of the X and Y are 2 and 3 respectively and income Constraint is birr 50. A,Calculate quantities of x and y which maximize utility. B,Calculate value of Lagrange multiplier. C,Calculate quantities of X and Y consumed with a given price. D,alculate optimum level of output .
Feyisa Reply
Answer
Feyisa
c
Jabir
the market for lemon has 10 potential consumers, each having an individual demand curve p=101-10Qi, where p is price in dollar's per cup and Qi is the number of cups demanded per week by the i th consumer.Find the market demand curve using algebra. Draw an individual demand curve and the market dema
Gsbwnw Reply
suppose the production function is given by ( L, K)=L¼K¾.assuming capital is fixed find APL and MPL. consider the following short run production function:Q=6L²-0.4L³ a) find the value of L that maximizes output b)find the value of L that maximizes marginal product
Abdureman
types of unemployment
Yomi Reply
What is the difference between perfect competition and monopolistic competition?
Mohammed
Got questions? Join the online conversation and get instant answers!
Jobilize.com Reply

Get Jobilize Job Search Mobile App in your pocket Now!

Get it on Google Play Download on the App Store Now


Source:  OpenStax, Siyavula textbooks: wiskunde (graad 11). OpenStax CNX. Sep 20, 2011 Download for free at http://cnx.org/content/col11339/1.4
Google Play and the Google Play logo are trademarks of Google Inc.

Notification Switch

Would you like to follow the 'Siyavula textbooks: wiskunde (graad 11)' conversation and receive update notifications?

Ask