

| << Chapter < Page | Chapter >> Page > |
Under these conditions, the rise in capital’s share in income will yield a growing gap between (r) and (g). Over time this will result in greater income flowing into the hands of capital owners and will increase their wealth. Their steadily growing wealth, coupled with high returns on capital and slow overall economic growth will exacerbate inequality in the distribution of wealth and income.
The projected increasing gap, between (r) and (g) is not the only factor, according to Piketty, that has led to growing concentration of wealth among the top decile since 1970 in the U.S. He cites another reason: sharply increased “supersalaries” for the “working rich”, primarily Chief Executive Officers (CEOs) of American publicly-owned firms.
Piketty and Piketty and Saez (2014) Piketty&Saez (2014), p.842. attribute very rapid growth of CEO salaries in large financial and non-financial firms to weakening governance of U.S. business firms. The argument is that Boards of Directors have become too timid to resist extravagant salary demands of CEOs. However, Piketty and Piketty and Saez offer but limited empirical support for this assertion. A detailed critique of the principal claims made by Piketty (and others may be found in the Appendix to this Chapter).
Five likely causes of growing inequality not cited prominently by Piketty include:
The growth of international trade and the growing interdependence between nations in goods and services markets as well as financial markets has clearly benefited emerging nations as a group. However the recent pattern of trade that has emerged: rapidly rising exports from emerging nations to developed nations, has adversely affected industries in the U.S. and Europe especially those that are relatively labor intensive, using simpler technologies.
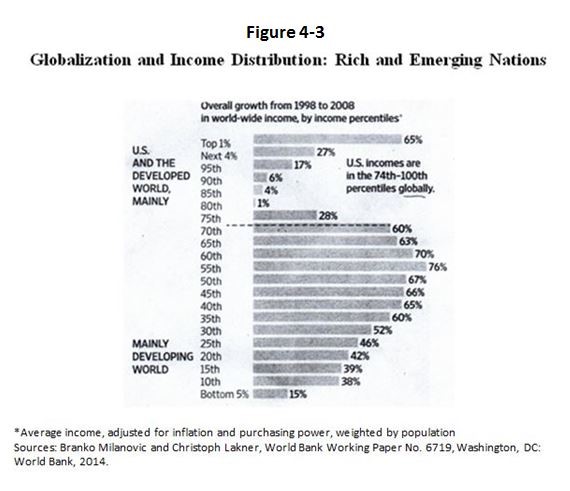
The effects of globalization on income distribution has been extensively researched by the World Bank, among other institutions. One Bank report indicates that globalization has increased income growth among lower and middle-income people in the developed nations of the West, while it has greatly benefited large numbers of people from the lowest deciles of the income distribution up to the 70th percentage especially in the mid-range of the income distribution (see Figure 4-3).
Another study by Branko Milankovic arrives at essentially the same conclusion. He estimated changes in per capita real income between 1988 and 2008. He found that while the income of the world’s richest did rise sharply, the greatest beneficiaries worldwide were individuals in the middle of the income distribution: the emerging middle classes in such nations as China, India and Indonesia. Nevertheless, inequality has indeed been rising within nations in both emerging and developed nations. Branko Milankovic, (2013, May), “Global Income Inequality in Numbers: in history and now”, Global Policy, 10: 124-133.
Technological change in the past 20 years has tended to make some occupations in the U.S. and Europe redundant. At the same time, demand for high-skilled workers has expanded rapidly. In the U.S. and Europe demand for low-skill labor has diminished leading to higher unemployment of lower and middle-income workers. Unfortunately the best way to increase income inequality is to have a growing number of people with zero income (i.e. a growing number of unemployed).
Technological change has surely been a factor in rising inequality. The benefits of technological change in recent years have not been evenly shared among work forces around the world. However, previous episodes of rapid technology change did not result in higher inequality in the U.S., at least. (Example: the electrification boom in 1920s in the U.S.).
Whether inequality increases or not can depend on the result on an ongoing race between education and technology. Especially in the U.S., declining educational attainment, relative to technological change, has played a role. According to one authoritative source, fewer jobs available at good wages have become increasingly unavailable for workers who lack advanced education. See Claudia Goldin&Lawrence Katz, (2010), The Race Between Education and Technology, Cambridge, MA: Belkna Press of Harvard University Press.
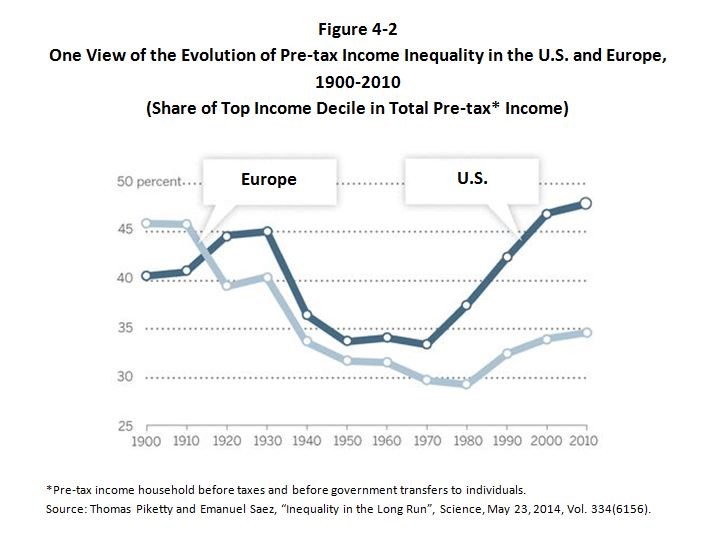
By the 1970s the U.S. was not only the richest nation on earth, it also had, by any measure, the most educated population. Income inequality in the U.S. then was little different from Europe. Only in the mid-70s, did things begin to change. Productivity growth stalled in the U.S. Income inequality started growing slowly at first, then at a faster pace. By 2012, the gulf between the richest 1% persons and the rest of the U.S. was the widest since 1928. The top 10% earned 19% of household incomes. And the top 10% captured 48% of total earnings in 2012. That the gap between the very rich and the poor has been widening is beyond dispute.
What might have been the roles of economic factors such as of technology and declining quality of public education K-12 in contributing to growing inequality in the U.S? Two economists, Claudia Goldin and Lawrence Katz, both at Harvard, recently concluded that in the race between education and technology, education was winning the race for most of the 20th century, up to about 1975. Ibid. But since then, the rate of change in technology doubtless overtook the rate of improvement in education quality, specifically in public education K-12, not in higher education. The slowdown in educational attainment is apparent by whatever standard employed. A commonly used standard is the results of the “gold standard” of international testing. Even as early as 1995, the Third International Math and Science Study (TIMSS) clearly indicated that the U.S. was far behind other nations in twelfth grade math and science. By 2012, the U.S. scores student assessment for math were but 481, far below South Korea (554) Finland (519) and Australia (504). Source: OECD, Programme for International Student Assessment (PISA) 2012, (Paris, 2012). Clearly the U.S. no longer leads the world in the education of young adults. The results of the recent rise between technology and education in the U.S. is evident from the observed shortages of skilled workers not only in such industries as information technology, biotechnology and information technology, but in building construction oil and gas exploration and developing as well as skilled electricians and plumbers.
The decline in educational quality in grades K-12 has not been due to lack of funding. The United States spends more of public money, in both absolute and per pupil terms on school-age children than any other nation. The outlay per pupil in 2013 was more than $13,000 per year in the U.S. This is one and a half times the average for all rich nations. “Choose Your Parents Wisely,” The Economist , July 26, 2014. Moreover, teachers’ salaries in the U.S. are on a par with (or in excess of) such countries as Finland, Czech Republic, Hungary, Australia, Britain and France. But while the U.S. is 19th in an international efficiency index, Finland, Czech Republic, Hungary and Australia are in the first ten in the index, and Britain and France are 11th and 12th.
The former State Superintendent of Schools in New York, Marc Bernstein, notes that only 1% of the State’s teachers receive valuation of “ineffective”. But in the 2013-14 school year, more than half of students in grades 4-8 were not proficient in either reading or math. Marc F. Bernstein (2014, September 30), “Where All the Teachers are Above Average”, Wall Street Journal .
There are other indicators of inadequacies in public education K-12. The former Mayor of Los Angeles (and also a former organizer for the United Teachers of Los Angeles) maintains that more than half the young people attending community colleges need to retake high school classes because the education they received was not vigorous enough. Antonio Villaraigosa (2010, July 21), “Why are Teachers Unions So Opposed to Change?” Wall Street Journal . More generally the number of all undergraduate students taking at least one remedial course rose from 1 million in 1999 to 2.7 million in 2011.
The decline in quality of the U.S. education system K-12 has also contributed to the recent fall in the competitiveness See Michael Porter&Jan Rivkin, __________________ of the U.S., since the 1995 study cited by Goldin and Katz. In a list compiled by Professor Michael Porter and colleagues of the 30 nations with the highest index of international competitiveness, the U.S. ranked 20th, whereas all the top seven nations in the competitiveness rankings have by whatever measures employed more effective systems of public education K-12. Sweden, Switzerland, Finland, Netherlands, Denmark, Singapore and Norway. See Robert J. Barro&Jong-Wha Lee (2000, April), “International Data on Educational Assessment” CID Working Paper #42, Cambridge, MA: Harvard University.
At the same time as rapid technological change has sharply increased the demand for skilled workers, the decline in quality of graduates of the U.S. K-12 systems has clearly not allowed the supply of needed, well trained workers to increase as fast as the rate of technological change. In such circumstances, firms begin bidding up the wages of the most skilled workers. But the poorly trained and educated have been losing ground, and economic inequality has thereby worsened, especially for the poorest 10%.
On the other hand, educational outcomes in the great majority of emerging nations have been steadily, if unevenly, improving, especially since 1985. These improvements are especially evident for literacy rates. Adult literacy rates for developing nations as a whole rose sharply from 60% of the adult population (those 15 years and over) to 72% in low income nations and fully 90% in middle income emerging nations. For 1985, see World Bank, Human Development Report 1991 , Washington, DC: World Bank. For 2007, see World Bank World Development Indicators 2009 , Washington, DC: World Bank.
Female literacy rates were substantially lower than for males in 1985 (66%). By 2007, the female rate rose to 76% of the male rate in the poorest nations and to 89% in middle income nations, reflecting gradually growing educational opportunities for women. An important reason for the climb in literacy rates in emerging nations was ongoing and widespread increase in years of schooling especially after 2003, with the single exception of war-town Afghanistan (World Development Report 2013).
However even there, levels of educational attainment in reading, mathematics and science have in general not risen as fast as gains in years of schooling and literacy, at least for the 25-odd emerging nations for which data on these indicators are available. Exceptions include Chile, Colombia, Indonesia, and Tunisia. World Bank, World Development Report 2013 , Figure 4-2.
Still the recent economic record suggests that, contrary to the experience of the United States, deterioration in the effectiveness of primary and secondary education in emerging nations has not contributed to income inequality; rather, improving educational outcomes have most likely reduced income inequality.
Among the important sociological factors contributing to growth in income inequality in recent decades has been the decline in two-parent households and the sharp rise in the proportion of U.S. families headed by a single parent, usually a mother. In 1964 93% of births occurred in families headed by two parents; only 7% of children were born to single mothers. The Heritage Foundation, Special Report #117 on Poverty and Inequality, September 2012. By 2012, the percentage of children born to single mothers increased to 29% for Caucasian families, 53% for Hispanics and 72% for African-Americans.
In families headed by married couples, only 7.5% had incomes below the 2012 poverty levels. But 34% of families headed by a single mother had incomes below the poverty level. Moreover 45% of children living only with their mother are in a household receiving food stamps, a clear mark of poverty. Jonathan Vespa, Jamie M. Lewis&Rose M. Kreider, (2013, August), “America’s Families and Living Arrangements: 2012”, U.S. Census Bureau. Retrieved from http://www.census.gov/prod/2013pubs/p20-570.pdf. Rapid growth in the number of these families has obvious effects on income distribution, as it significantly reduces the share of the lowest decile in income.
Growing lack of English language proficiency has clearly contributed to growth in inequality in the U.S. According to a 2013 study by the Washington-based think tank, the Brookings Institution, nearly one tenth (9.3%) of working-age adults had limited proficiency. This is 2.5 times as many as in 1980. Metropolitan Policy Program, The Brookings Institution (2014, September 24), Limited English Proficient Workers More Productive with Increased Investment in English . Most of the 19.2 million people with limited English in 2013 were Spanish speakers, mostly immigrants from Mexico, Honduras, El Salvador and other Latin American nations.
Clearly lack of English proficiency does not preclude immigrant workers from finding jobs. But it does prevent them from holding higher-paying jobs. The share of the immigrant population in the U.S. labor force grew from 7% in 1980 to 16% in 2012. As long as limited English proficiency remains widespread among immigrants, income inequality rising from their source will likely increase over the coming years. Earlier in this chapter we observed that contrary to recent experience in the U.S., France and Britain, income inequality in emerging nations has generally moved toward less inequality. This has been particularly so in one region long noted for extremes in income distribution: Latin America. According to the Economic Commission for Latin America (ECLA), of the 18 countries there for which data exists, income inequality narrowed in 16 nations from 2002-08. United Nations, Economic Commission for Latin America (ECLA) , (Santiago, Chile, 2011).
In addition, Latin American poor have generally been doing much better since 1990 because of rapid recent economic growth. In that year, 48.4% of the region’s population lived below national poverty lines (income insufficient to cover basic food needs). But by 2010, only 30.4% of the people in the region lived below their nation’s respective poverty lines. Ibid.
We have seen that income distribution in most emerging nations generally has moved forward less inequality. However, some of the reasons for rising inequality in the U.S. and Europe since 1975 may eventually become significant in some emerging nations.
As noted earlier recent globalization has redounded to low and middle income households benefit of lower and middle income nations (see Chapter 3, Figure ___). But these and other gains from globalization cannot go on forever. International trade has already expanded to 27% of world GDP even by 1992, well beyond what would have been expected only 25 years ago. So sooner or later the income distribution gains to emerging nations from international trade (see again Figure 4-3) will be largely exhausted.
At the same time, technological advances may increasingly displace labor not only in rich but in poor nations (see Chapter 7-A). Both these factors – possible declining benefits from globalization and the shape of future technological change could erode much of the gains in income equality in emerging nations over the coming years.
Notification Switch
Would you like to follow the 'Economic development for the 21st century' conversation and receive update notifications?

|
|

|
|

|
|

|
|

|
|

|
|

|
|

|
|

|
|

|