

| << Chapter < Page | Chapter >> Page > |
To continue the investigation, suppose that the carrier phase offset is zero, (i.e., ), but that the frequency offset is not. Then the spectrum of from [link] is
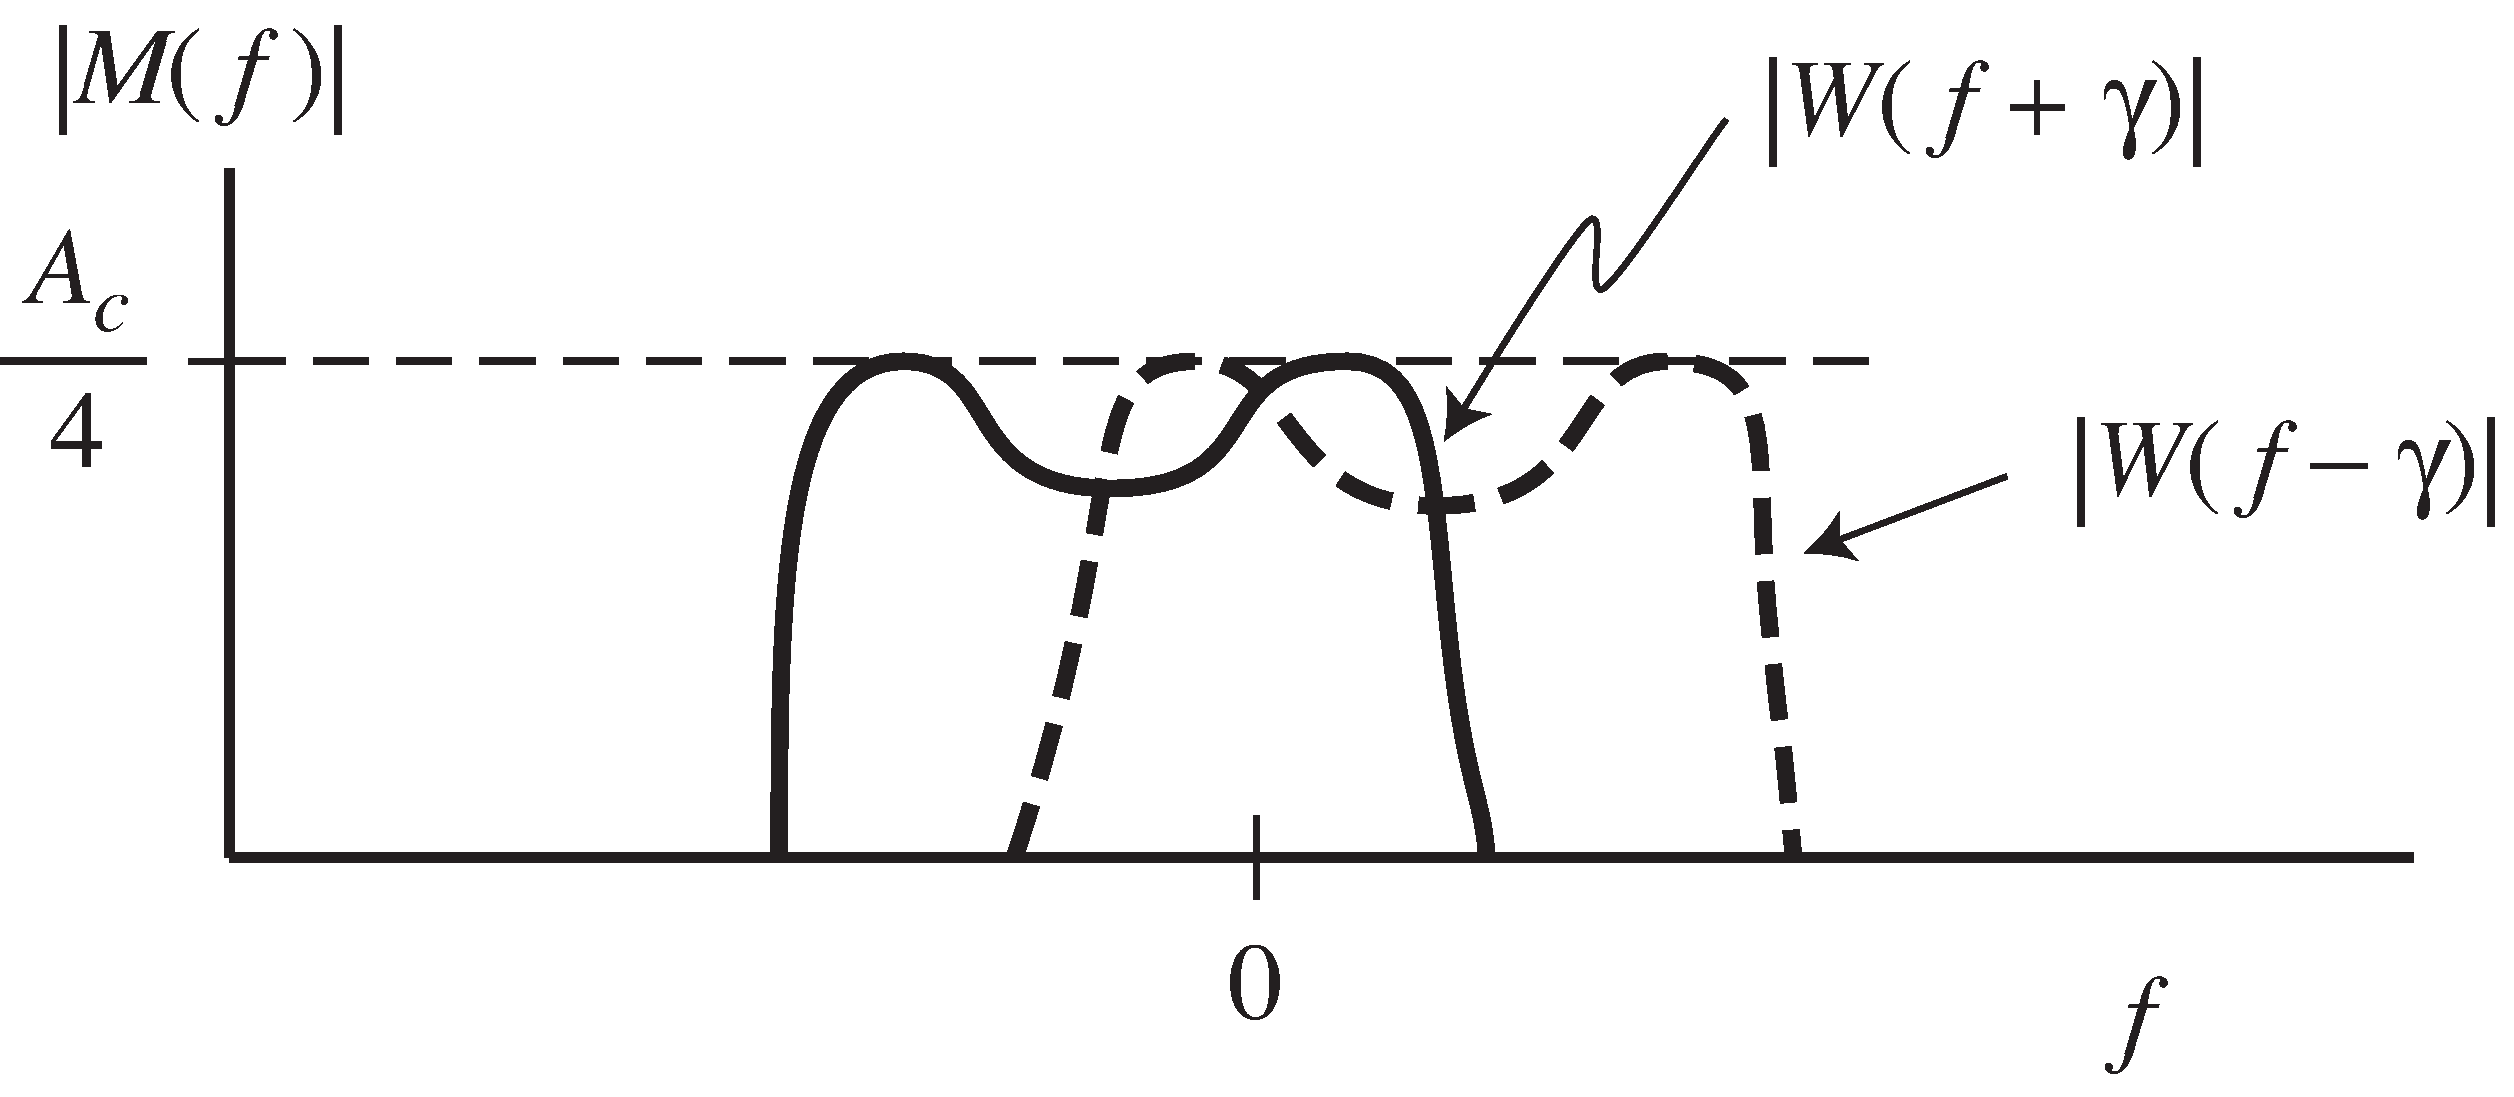
and the lowpass filtering of produces
This is shown in [link] . Recognizing this spectrum as a frequency shiftedversion of , it can be translated back into the time domain using [link] to give
Instead of recovering the message , the frequency offset causes the receiver to recover a low frequencyamplitude modulated version of it. This is bad with even a small carrier frequency offset.While in [link] is a fixed scaling, in [link] is a time-varying scaling that will alternately recover (when ) and make recovery impossible (when ). Transmitters are typically expected to maintain suitableaccuracy to a nominal carrier frequency setting known to the receiver. Ways of automatically tracking (inevitable) smallfrequency deviations are discussed at length in [link] .
The following code
AM.m generates a message
and
modulates it with a carrier at frequency
.
The demodulation is done with a cosine offrequency
and a phase offset of
.
When
and
, the output
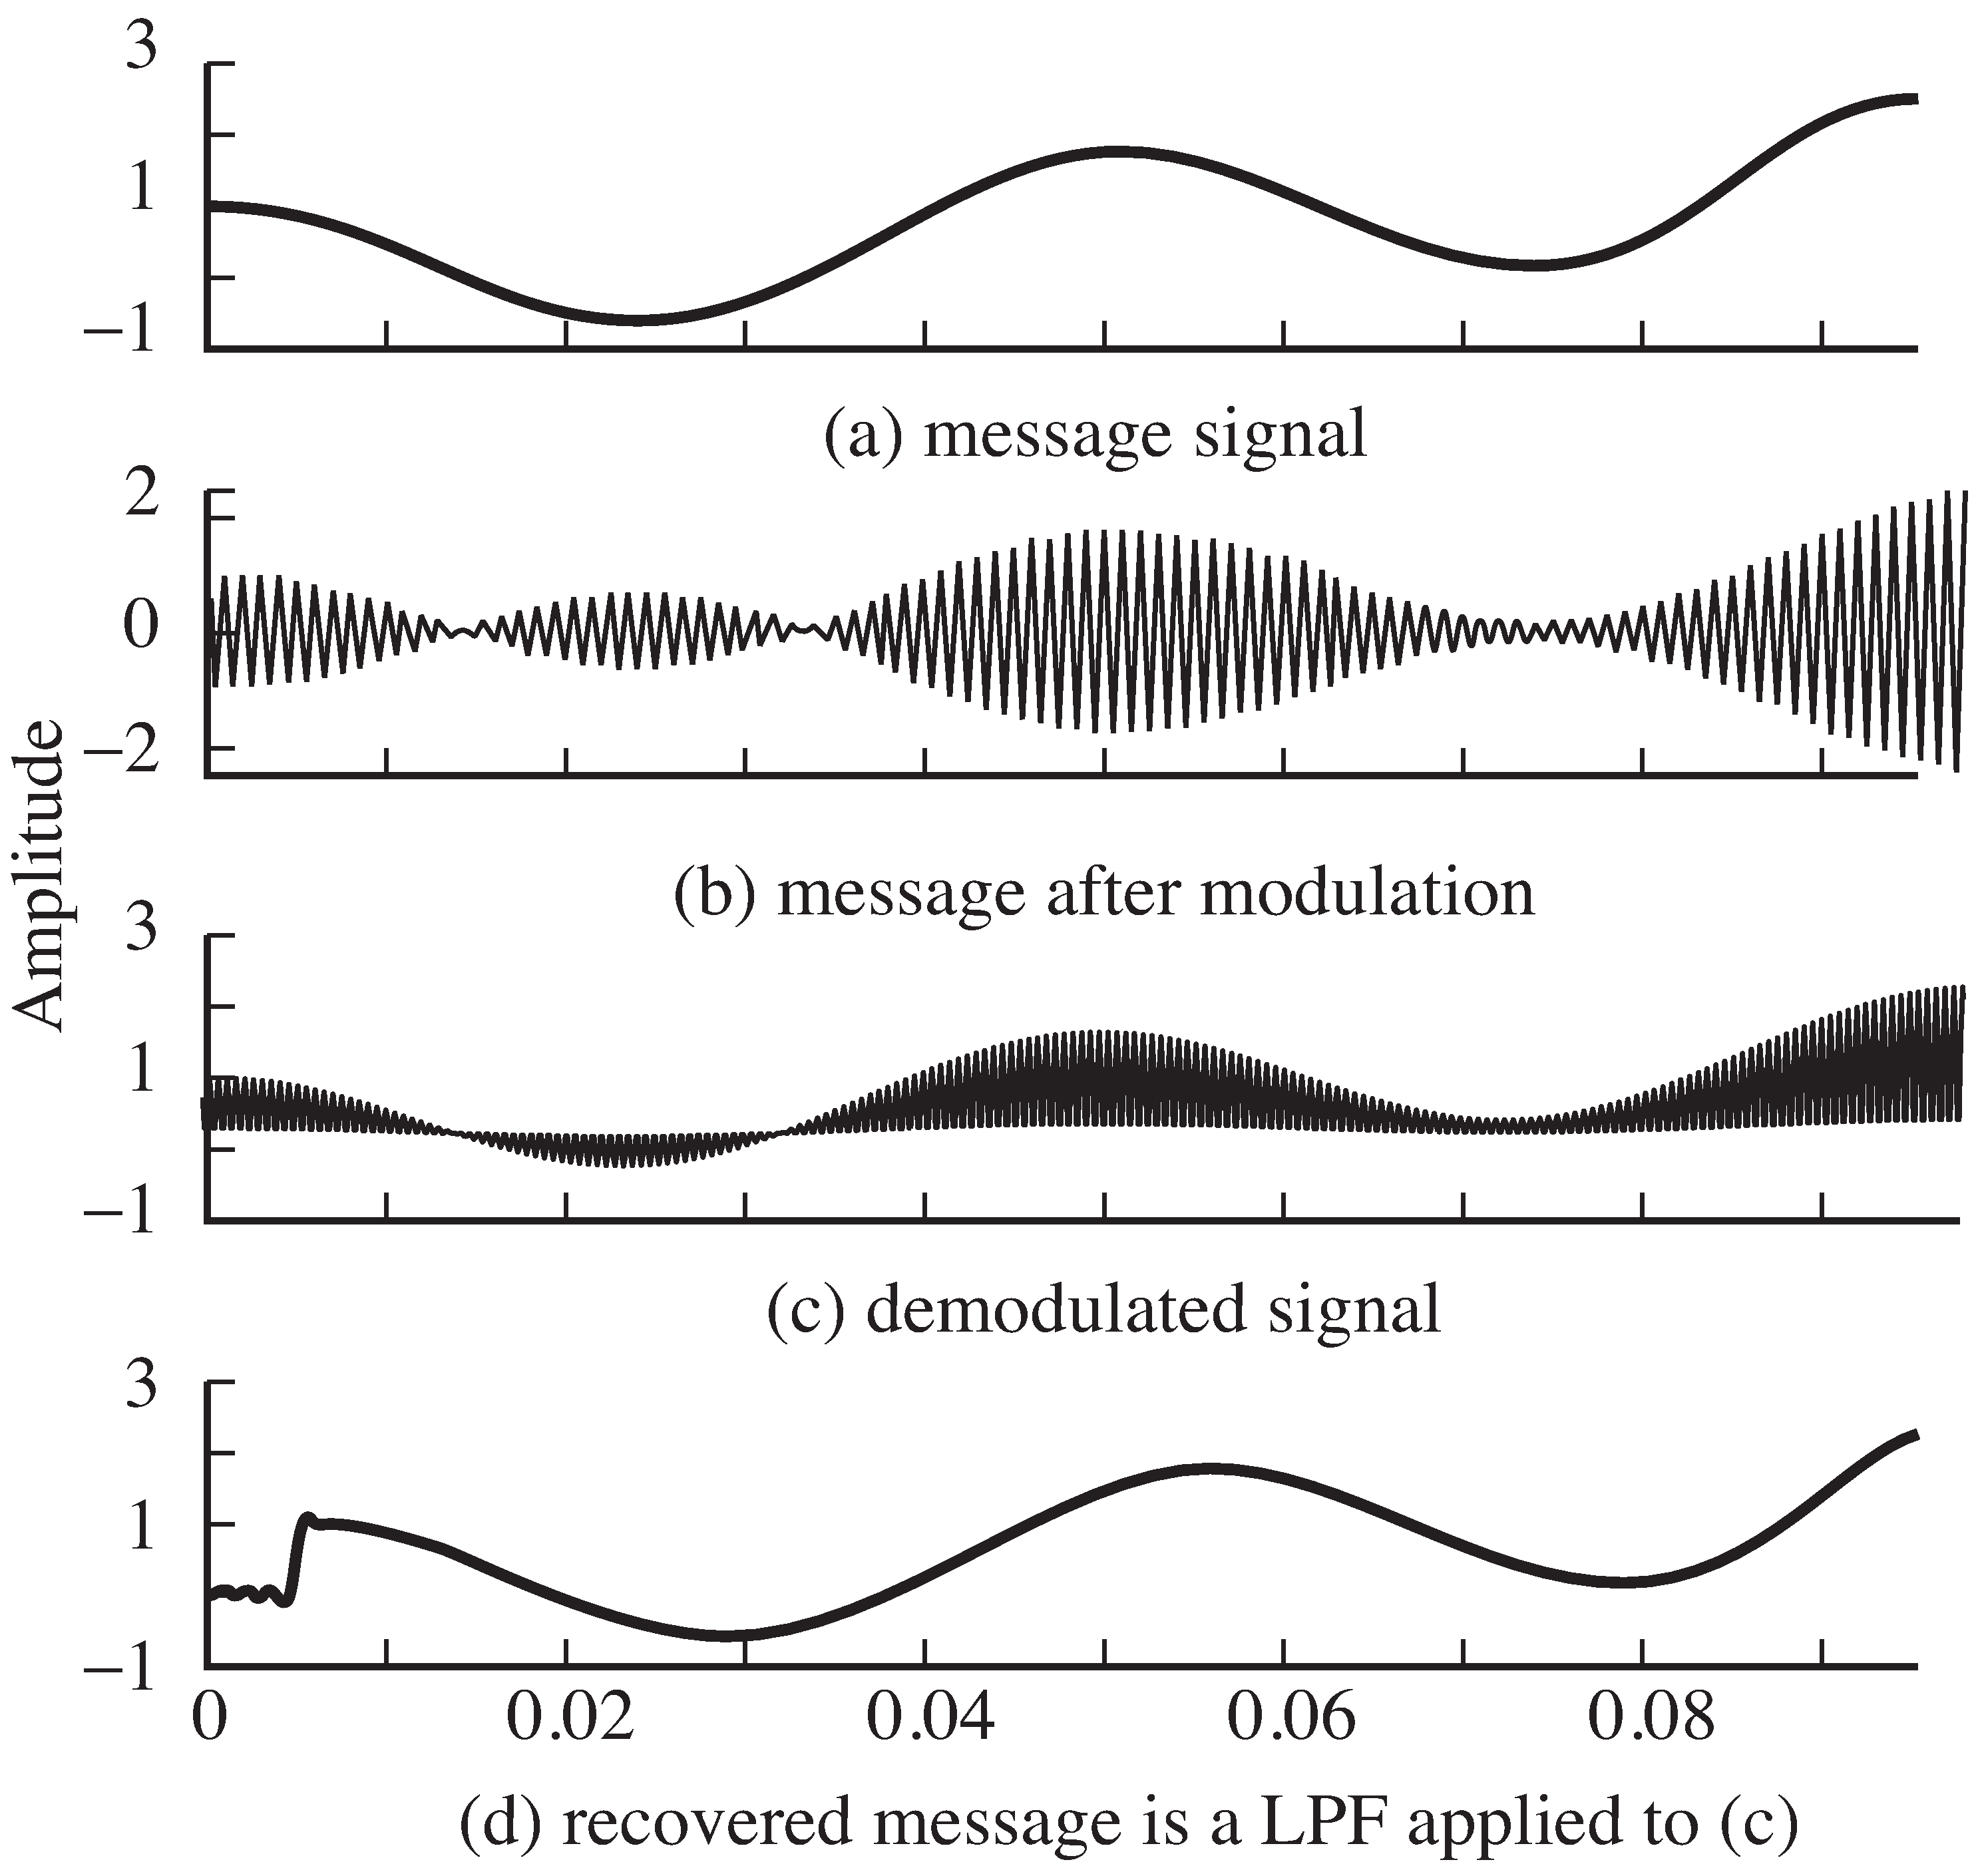
(a lowpass version of the demodulated signal)is nearly identical to the original message,
except for the inevitable delay caused by the linearfilter.
[link] shows four plots:
the message
on top, followed by the upconverted signal
,
followed in turn by the downconverted signal
.
The lowpass filtered versionis shown in the bottom plot; observe that it is nearly identical
to the original message, albeit with a slight delay.
time=.3; Ts=1/10000;                        % sampling interval and time base
t=Ts:Ts:time; lent=length(t);               % define a "time" vectorfc=1000; c=cos(2*pi*fc*t);                  % define the carrier at freq fc
fm=20; w=5/lent*(1:lent)+cos(2*pi*fm*t);    % create "message"v=c.*w;                                     % modulate with carrier
gam=0; phi=0;                               % freq & phase offset
c2=cos(2*pi*(fc+gam)*t+phi);                % create cosine for demodx=v.*c2;                                    % demod received signal
fbe=[0 0.1 0.2 1]; damps=[1 1 0 0]; fl=100;  % low pass filter designb=firpm(fl,fbe,damps);                      % impulse response of LPF
m=2*filter(b,1,x);                          % LPF the demodulated signal

AM.m  suppressed carrier with (possible) freq and phase offset
(download file)
Using
AM.m as a starting point,
plot the spectra of
,
,
,
and
.
Try different phase offsets , , , , 0, , , , . How well does the recovered message match the actual message ? For each case, what is the spectrum of ?
Notification Switch
Would you like to follow the 'Software receiver design' conversation and receive update notifications?

|
|

|
|

|
|

|
|

|
|

|
|

|
|

|
|

|
|

|