

| << Chapter < Page | Chapter >> Page > |
Thus, the impulse response describes how a system behaves directly in time, while the frequency responsedescribes how it behaves in frequency. The two descriptions are intimately related because the frequency response is theFourier transform of the impulse response. This will be used repeatedly in [link] to design filters for the manipulation (augmentation or removal)of specified frequencies.
In Exercise [link] , a system was defined to have an impulse response that is a sinc function.The Fourier transform of a sinc function in time is a rect function in frequency [link] . Hence, the frequency response of the system is a rectangle that passes all frequencies below and removes all frequencies above (i.e., the system is a lowpass filter).
M
atlab can help to visualize the relationship between
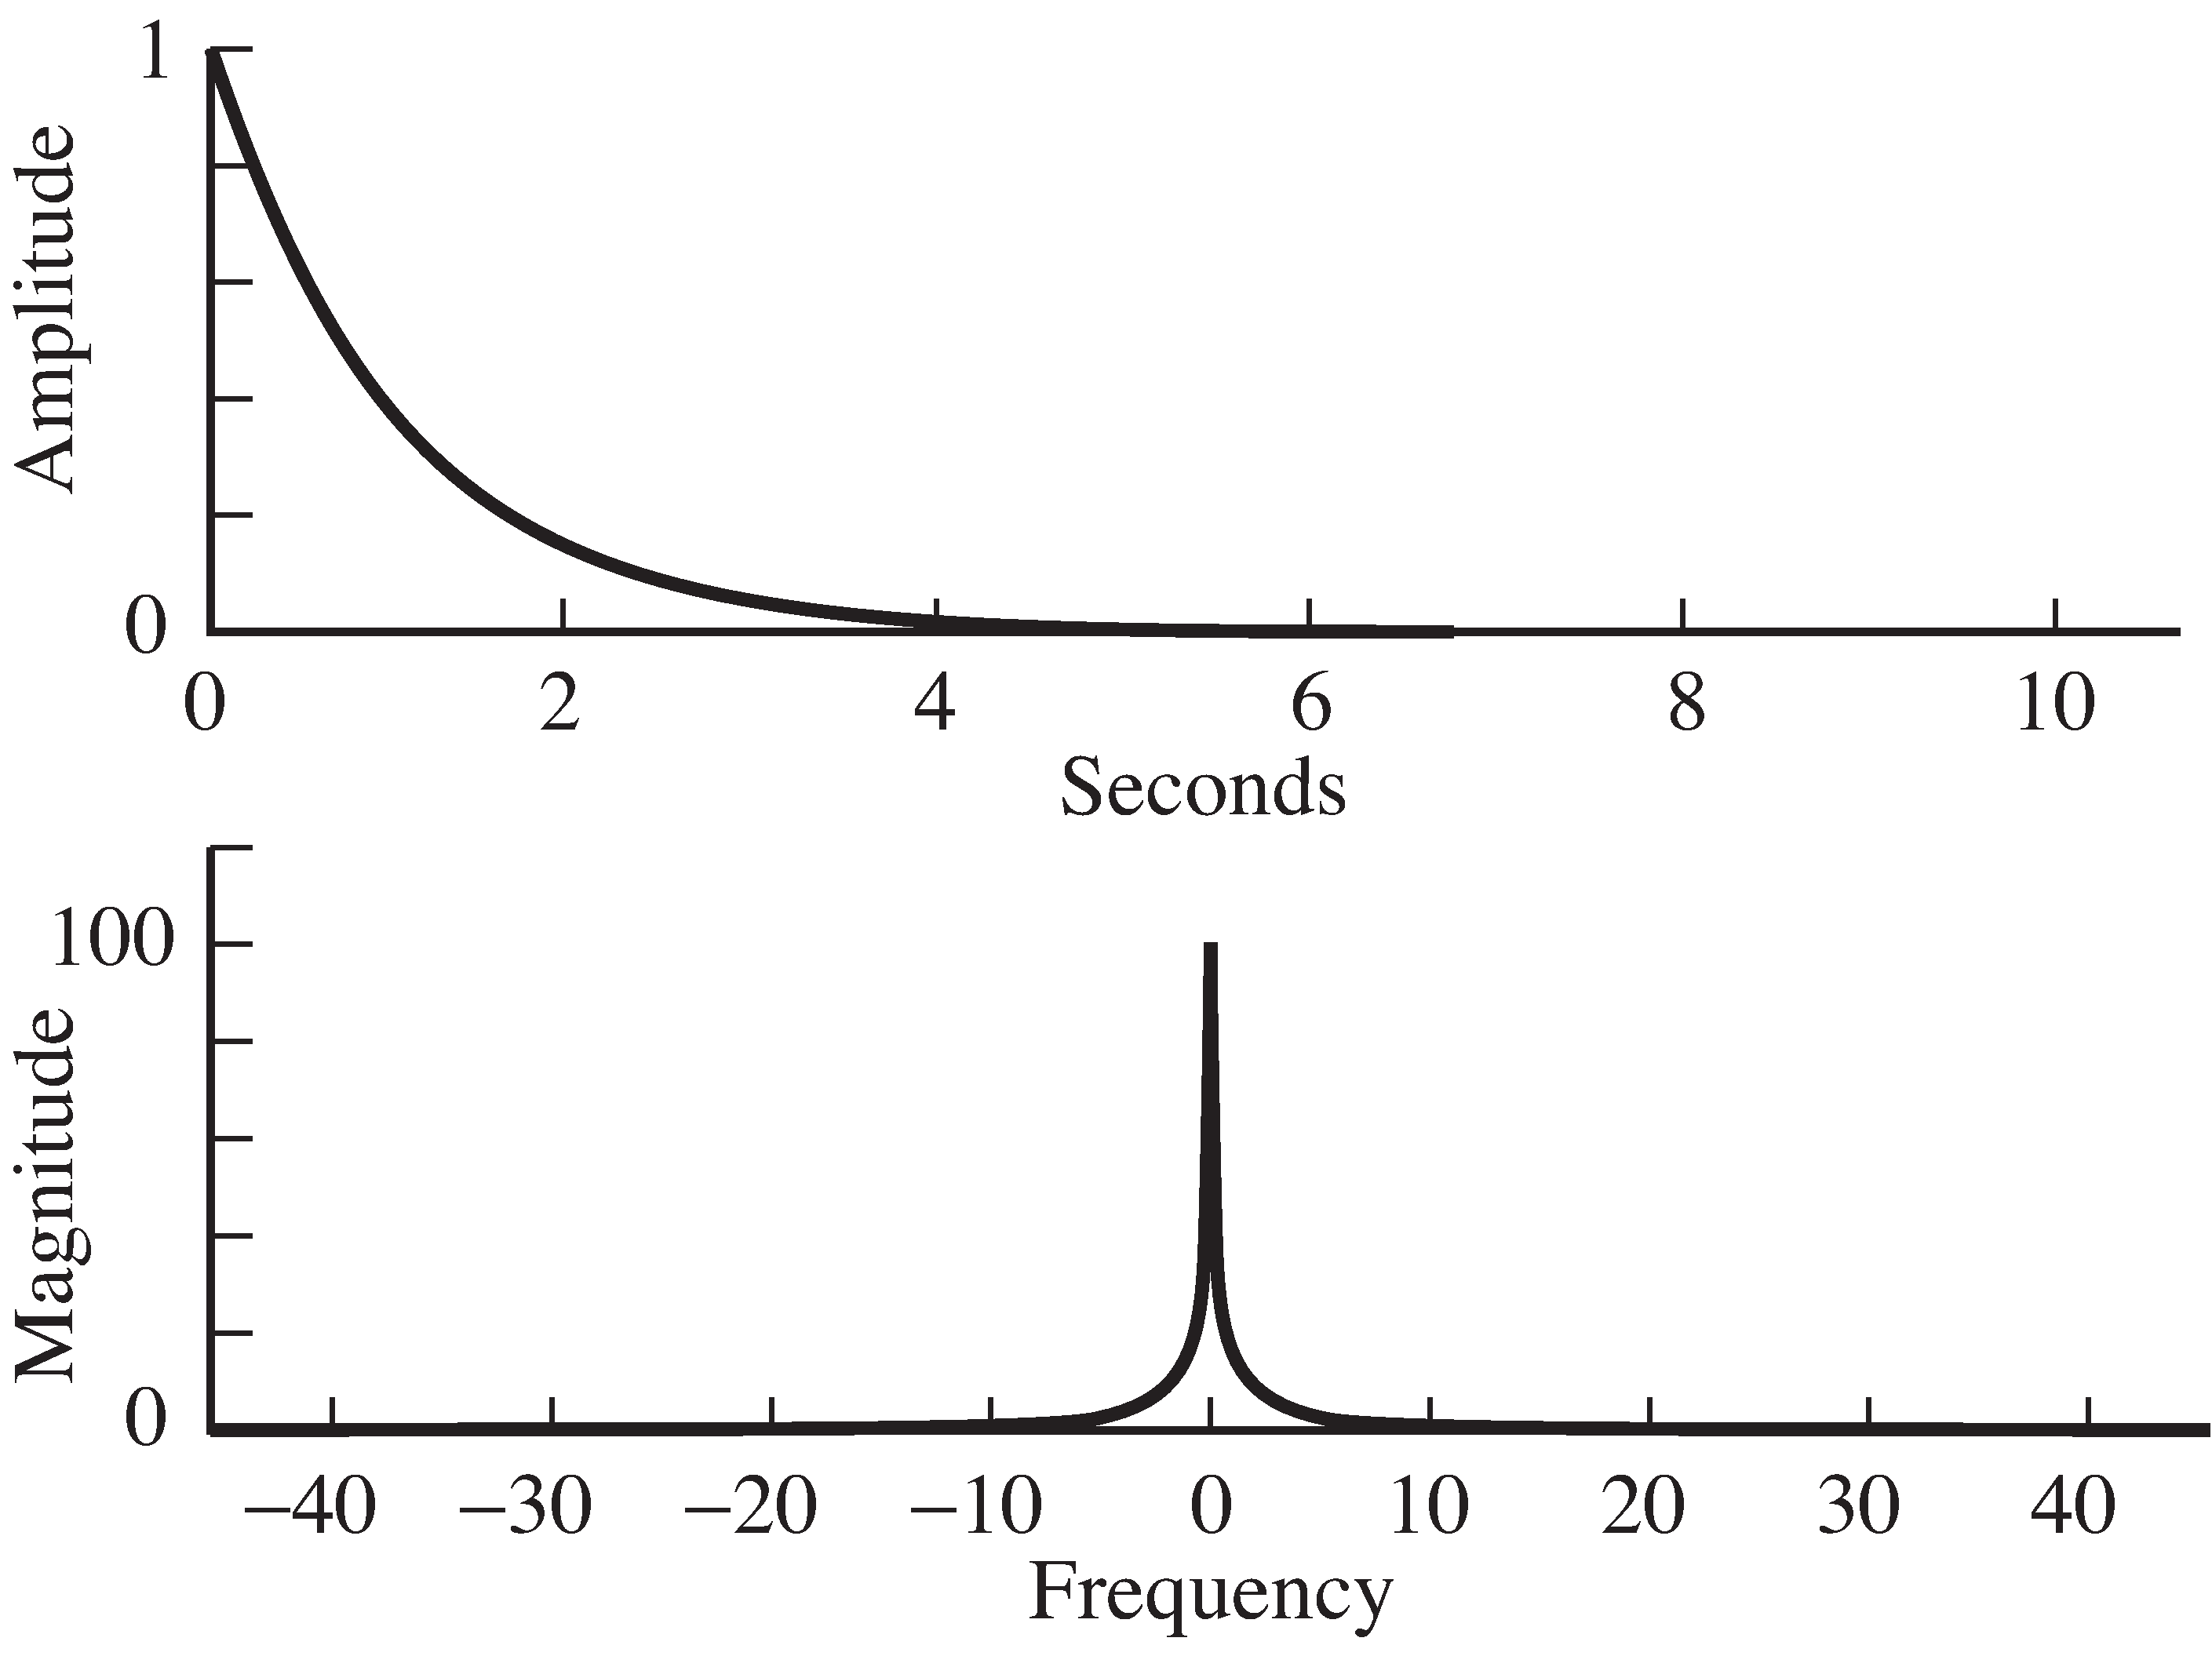
the impulse response and the frequency response.For instance, the system in
convolex.m is defined
via its impulse response, which is a decaying exponential.
[link] shows its
output when the input is a simple sum of delta functions, andExercise
[link] explores the output when the
input is a white noise. In
freqresp.m , the behavior
of this system is explained by looking at its frequency response.
Ts=1/100; time=10;             % sampling interval and total time
t=0:Ts:time;                   % create time vectorh=exp(-t);                     % define impulse response
plotspec(h,Ts)                 % find and plot frequency response

freqresp.m  numerical example of impulse and frequency response
(download file)
The output of
freqresp.m is shown in
[link] .
The frequency response of the system (which is just the magnitude spectrum ofthe impulse response) is found using
plotspec.m .
In this case, the frequency response amplifies low frequenciesand attenuates other frequencies more as the
frequency increases. This explains, for instance, why the output of theconvolution in Exercise
[link] contained (primarily) lower frequencies, as evidenced by the
slower undulations in time.
Suppose a system has an impulse response that is a
function.
Using
freqresp.m , find the frequency response of
the system. What kind of filter does this represent?Hint: center the
in time; for instance, use
h=sinc(10*(t-time/2)) .
Suppose a system has an impulse response that is a
function.
Using
freqresp.m , find the frequency response of
the system. What kind of filter does this represent?Can you predict the relationship between the frequency of the
sine wave and the location of the peaks in the spectrum?Hint: try
h=sin(25*t) .
Create a simulation (analogous to
convolex.m ) that
inputs white noise into a system with impulse responsethat is a
function
(as in Exercise
[link] ).
Calculate the spectra of the input and outputusing
plotspec.m .
Verify that the system behaves as suggested by thefrequency response in Exercise
[link] .
Notification Switch
Would you like to follow the 'Software receiver design' conversation and receive update notifications?

|
|

|
|

|
|

|
|

|
|

|
|

|
|

|
|
|
|
|
|
|