

| << Chapter < Page | Chapter >> Page > |
So far, "Convolution ⇔ Multiplication" has emphasized the idea of finding the frequency response of a system as a way to understand its behavior.Reversing things suggests another use. Suppose it was necessary to build a filter with some specialcharacteristic in the frequency domain (for instance, in order to accomplish one of the goals of bandpass filtering in "When Bad Things Happen to Good Signals" ). It is easy to specify the filter in the frequency domain. Its impulse response can thenbe found by taking the inverse Fourier transform, and the filter can be implemented using convolution.Thus, the relationship between impulse response and frequency response can be used both to study and to design systems.
In general, this method of designing filters is not optimal (in the sense that other design methodscan lead to more efficient designs), but it does show clearly what the filter is doing, and why. Whatever the designprocedure, the representation of the filter in the time domain and its representation in the frequency domainare related by nothing more than a Fourier transform.
"When Bad Things Happen to Good Signals" described several kinds of corruption that a signal may encounter as it travels fromthe transmitter to the receiver. This section shows how linear filters can help. Perhaps the simplest way a linear bandpass filter can be usedis to remove broadband noise from a signal. (Recall "Broadband Noise" and especially [link] .)
A common way to quantify noise is the signal-to-noise ratio (SNR) which is the ratio of the power of the signalto the power of the noise at a given point in the system. If the SNR at one point is larger than theSNR at another point, then the performance is better because there is more signal in comparison to the amount ofnoise. For example, consider the SNR at the input and the output of a BPF as shown in [link] . The signal at the input ( in part (a)) is composed of the message signal and the noise signal , and the SNR at the input is therefore
Similarly, the output is composed of a filtered version of the message ( in part (b)) and a filtered version of the noise ( in part (b)). The SNR at the output can therefore be calculated as
Observe that the SNR at the output cannot be calculated directly from (since the two components are scrambled together). But, since the filter is linear,
which effectively shows the equivalence of parts (a) and (b) of [link] .

The M
atlab program
improvesnr.m explores this scenario
concretely. The signal
x is a bandlimited signal,
containing only frequencies between 3000 and 4000 Hz.This is corrupted by a broadband noise
n (perhaps caused by an internally generated thermal noise) to form
the received signal. The SNR of this input
snrinp is calculated as the ratio of the power of the signal
x to the
power of the noise
n .
The output of the BPF at the receiver is
y , which is
calculated as a BPF version of
x+n .The BPF is created using the
firpm command
just like the bandpass filter in
filternoise.m .
To calculate the SNR of
y , however, the code
also implements the system in the alternative formof part (b) of
[link] .
Thus,
yx and
yn represent the signal
x filtered
through the BPF and the noise
n passed through the
same BPF. The SNR at the outputis then the ratio of the power in
yx to the
power in
yn , which is calculated using the
function
pow.m , available on the website.
time=3; Ts=1/20000;                 % length of time and sampling interval
freqs=[0 0.29 0.3 0.4 0.41 1];
amps=[0 0 1 1 0 0];
b=firpm(100,freqs,amps);            % BP filtern=0.25*randn(1,time/Ts);            % generate white noise signal
x=filter(b,1,2*randn(1,time/Ts));   % bandlimited signal between 3K and 4Ky=filter(b,1,x+n);                  % (a) filter the received signal+noise
yx=filter(b,1,x); yn=filter(b,1,n);  % (b) filter signal and noise separatelyz=yx+yn;                            % add them
diffzy=max(abs(z-y))                % and make sure y and z are equalsnrinp=pow(x)/pow(n)                % SNR at input
snrout=pow(yx)/pow(yn)              % SNR at output

improvesnr.m  using a linear filter to improve SNR
(download file)
Since the data generated in
improvesnr.m is random,
the numbers are slightly different each time the program is run.Using the default values, the SNR at the input is about
,
while the SNR at the output is about 61. This is certainlya noticeable improvement. The variable
diffzy shows the
largest difference between the two ways of calculating the output(that is, between parts (a) and (b) of
[link] ).
This is on the order of
, which is effectively the numerical
resolution of M
atlab calculations, indicating that the two are
(effectively) the same.
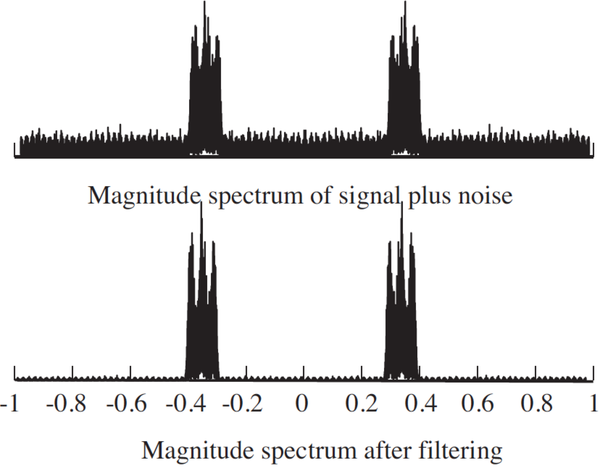
[link] plots the spectra of the input
and the output of a typical run of
improvesnr.m .
Observe the large noise floor in the top plot, and howthis is reduced by passage through the BPF. Observe also
that the signal is still changed by the noise in thepass band between 3000 and 4000 Hz, since the BPF has
no effect there.
The program
improvesnr.m can be thought of as a simulation
of the effect of having a BPF at the receiver for the purposes ofimproving the SNR when the signal is corrupted by broadband noise,
as was described in
"Broadband Noise" .
The following problems ask you to mimic the code in
improvesnr.m to simulate the benefit of applying filters to the other problems
presented in
"When Bad Things Happen to Good Signals" .
Suppose that the noise in
improvesnr.m is
replaced with narrowband noise (as discussed in
"Narrowband Noise" ). Investigate the improvements in SNR
Suppose that the noise in
improvesnr.m is
replaced with “other users” who occupy different frequency bands(as discussed in
"Other Users" ).
Are there improvements in the SNR?
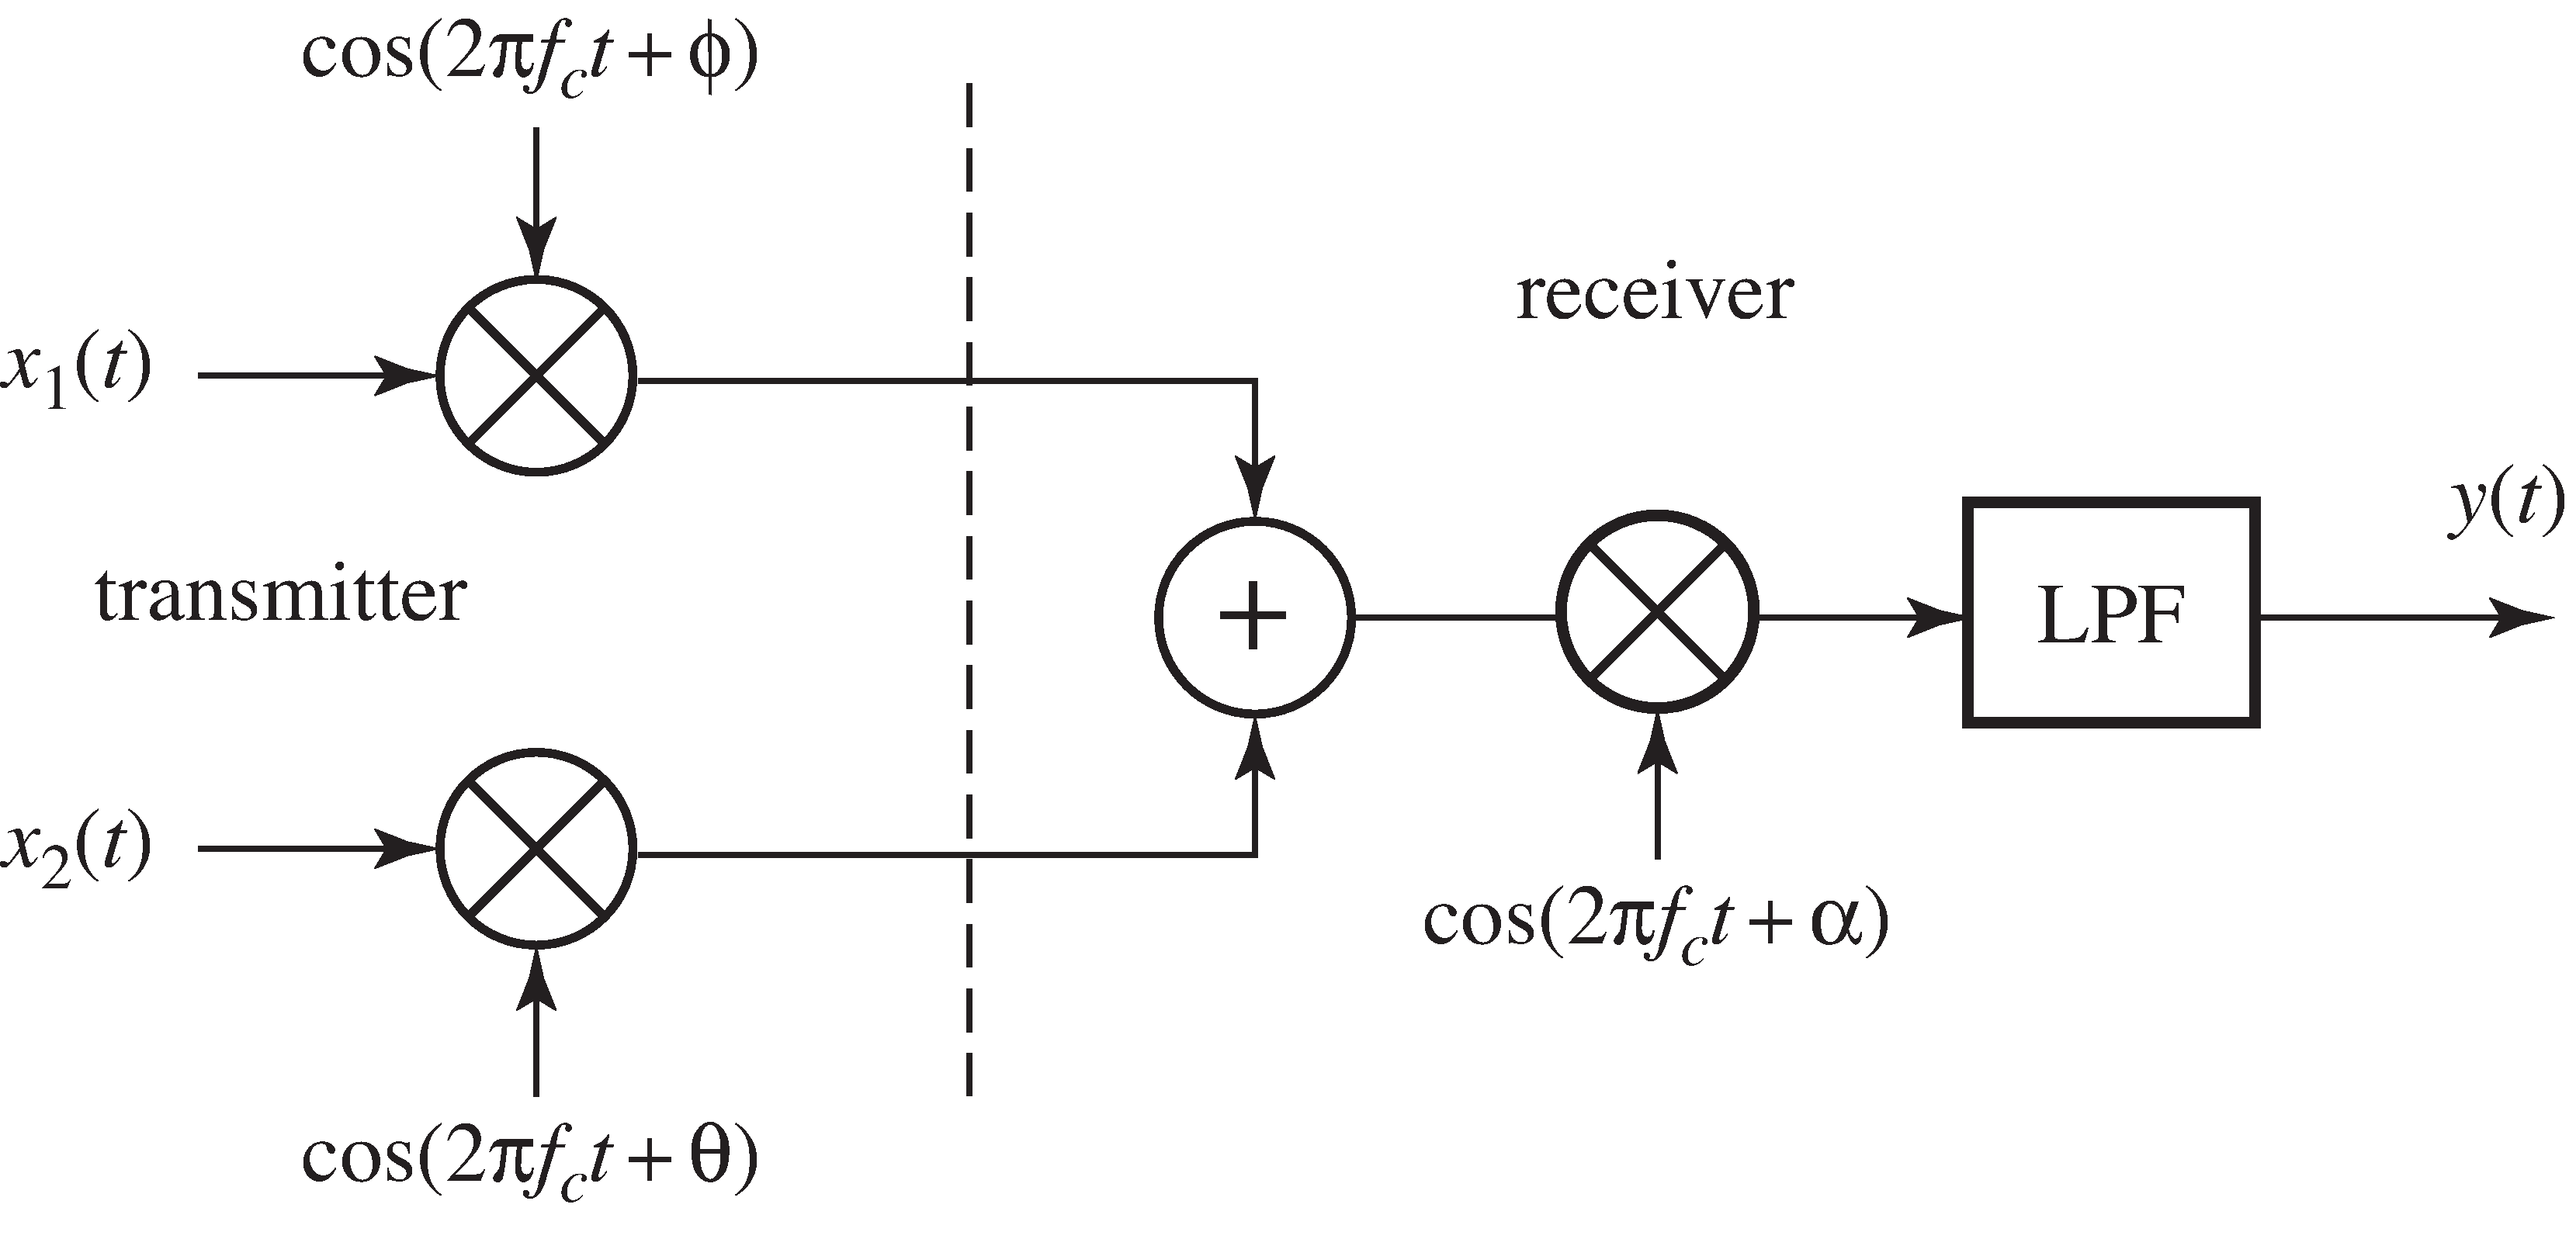
Consider the interference between two users and occupying the same frequency band as shown in [link] . The phases of the two mixers at the transmitter are unequalwith . The lowpass filter (LPF) has a cutoff frequency of , a passband gain of 1.5, a stopband gain of zero, andzero phase at zero frequency.
The other two problems posed in "When Bad Things Happen to Good Signals" were multipath interference and fading. These require more sophisticated processing because the design of the filtersdepends on the operating circumstances of the system. These situations will be discussed in detail in Chapters [link] and [link] .
An early description of the linearity of communication channels can be found in
Notification Switch
Would you like to follow the 'Software receiver design' conversation and receive update notifications?

|
|

|
|

|
|

|
|

|
|

|
|

|
|
|
|
|

|
|

|