

| << Chapter < Page | Chapter >> Page > |
Other factors in human population growth are migration and public health. Humans originated in Africa, but we have since migrated to nearly all inhabitable land on Earth, thus, increasing the area that we have colonized. Public health, sanitation, and the use of antibiotics and vaccines have decreased the ability of infectious disease to limit human population growth in developed countries. In the past, diseases such as the bubonic plaque of the fourteenth century killed between 30 and 60 percent of Europe’s population and reduced the overall world population by as many as one hundred million people. Infectious disease continues to have an impact on human population growth. For example, life expectancy in sub-Saharan Africa, which was increasing from 1950 to 1990, began to decline after 1985 largely as a result of HIV/AIDS mortality. The reduction in life expectancy caused by HIV/AIDS was estimated to be 7 years for 2005. Danny Dorling, Mary Shaw, and George Davey Smith, “Global Inequality of Life Expectancy due to AIDS,” BMJ 332, no. 7542 (March 2006): 662-664, doi: 10.1136/bmj.332.7542.662.
Declining life expectancy is an indicator of higher mortality rates and leads to lower birth rates.
The fundamental cause of the acceleration of growth rate for humans in the past 200 years has been the reduced death rate due to a development of the technological advances of the industrial age, urbanization that supported those technologies, and especially the exploitation of the energy in fossil fuels. Fossil fuels are responsible for dramatically increasing the resources available for human population growth through agriculture (mechanization, pesticides, and fertilizers) and harvesting wild populations.
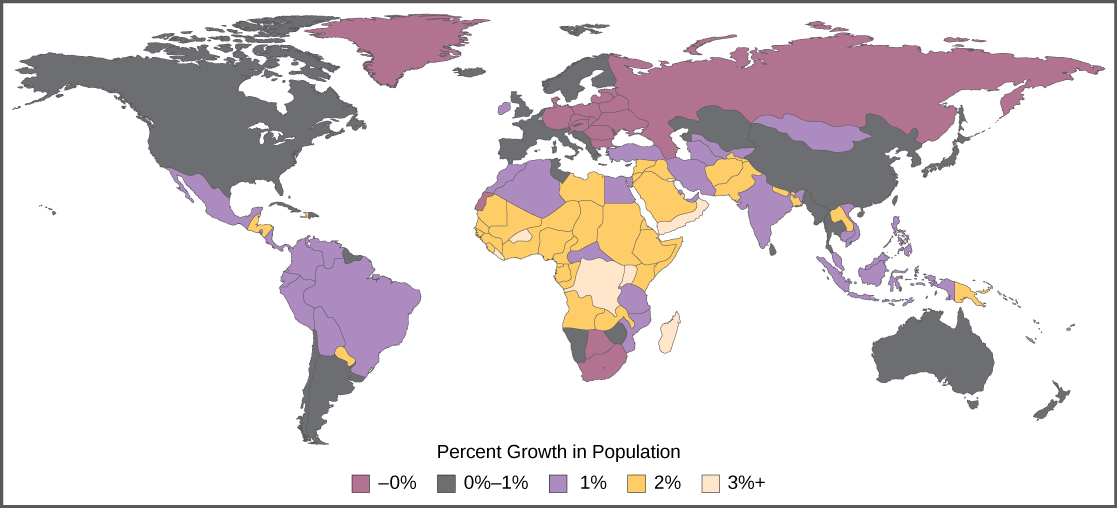
The age structure of a population is an important factor in population dynamics. Age structure is the proportion of a population in different age classes. Models that incorporate age structure allow better prediction of population growth, plus the ability to associate this growth with the level of economic development in a region. Countries with rapid growth have a pyramidal shape in their age structure diagrams, showing a preponderance of younger individuals, many of whom are of reproductive age ( [link] ). This pattern is most often observed in underdeveloped countries where individuals do not live to old age because of less-than-optimal living conditions, and there is a high birth rate. Age structures of areas with slow growth, including developed countries such as the United States, still have a pyramidal structure, but with many fewer young and reproductive-aged individuals and a greater proportion of older individuals. Other developed countries, such as Italy, have zero population growth. The age structure of these populations is more conical, with an even greater percentage of middle-aged and older individuals. The actual growth rates in different countries are shown in [link] , with the highest rates tending to be in the less economically developed countries of Africa and Asia.
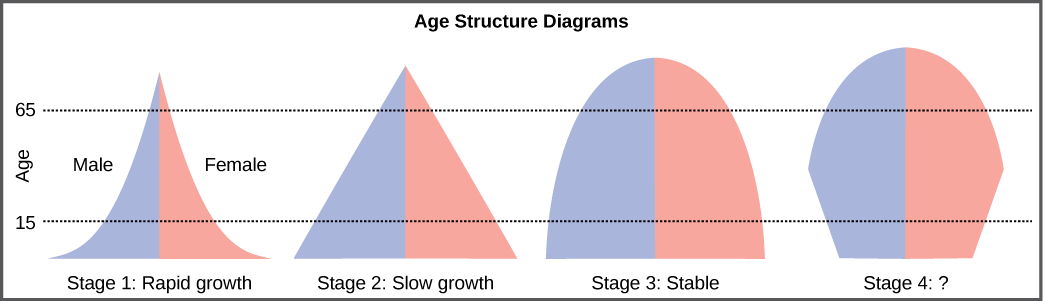
Age structure diagrams for rapidly growing, slow growing, and stable populations are shown in stages 1 through 3. What type of population change do you think stage 4 represents?
Many dire predictions have been made about the world’s population leading to a major crisis called the “population explosion.” In the 1968 book The Population Bomb , biologist Dr. Paul R. Ehrlich wrote, “The battle to feed all of humanity is over. In the 1970s hundreds of millions of people will starve to death in spite of any crash programs embarked upon now. At this late date nothing can prevent a substantial increase in the world death rate.” Paul R. Erlich, prologue to The Population Bomb , (1968; repr., New York: Ballantine, 1970). While many critics view this statement as an exaggeration, the laws of exponential population growth are still in effect, and unchecked human population growth cannot continue indefinitely.
The United Nations estimates the future world population size could vary from 6 billion (a decrease) to 16 billion people by the year 2100. There is no way to know whether human population growth will moderate to the point where the crisis described by Dr. Ehrlich will be averted.
Another consequence of population growth is the change and degradation of the natural environment. Many countries have attempted to reduce the human impact on climate change by limiting their emission of greenhouse gases. However, a global climate change treaty remains elusive, and many underdeveloped countries trying to improve their economic condition may be less likely to agree with such provisions without compensation if it means slowing their economic development. Furthermore, the role of human activity in causing climate change has become a hotly debated socio-political issue in some developed countries, including the United States. Thus, we enter the future with considerable uncertainty about our ability to curb human population growth and protect our environment to maintain the carrying capacity for the human species.
Visit this website and select “Launch the movie” for an animation discussing the global impacts of human population growth.
Earth’s human population is growing exponentially. Humans have increased their carrying capacity through technology, urbanization, and harnessing the energy of fossil fuels. The age structure of a population allows us to predict population growth. Unchecked human population growth could have dire long-term effects on human welfare and Earth’s ecosystems.
Notification Switch
Would you like to follow the 'Environmental biology' conversation and receive update notifications?

|
|

|
|

|
|

|
|

|
|

|
|

|
|

|
|

|
|

|