

| << Chapter < Page | Chapter >> Page > |
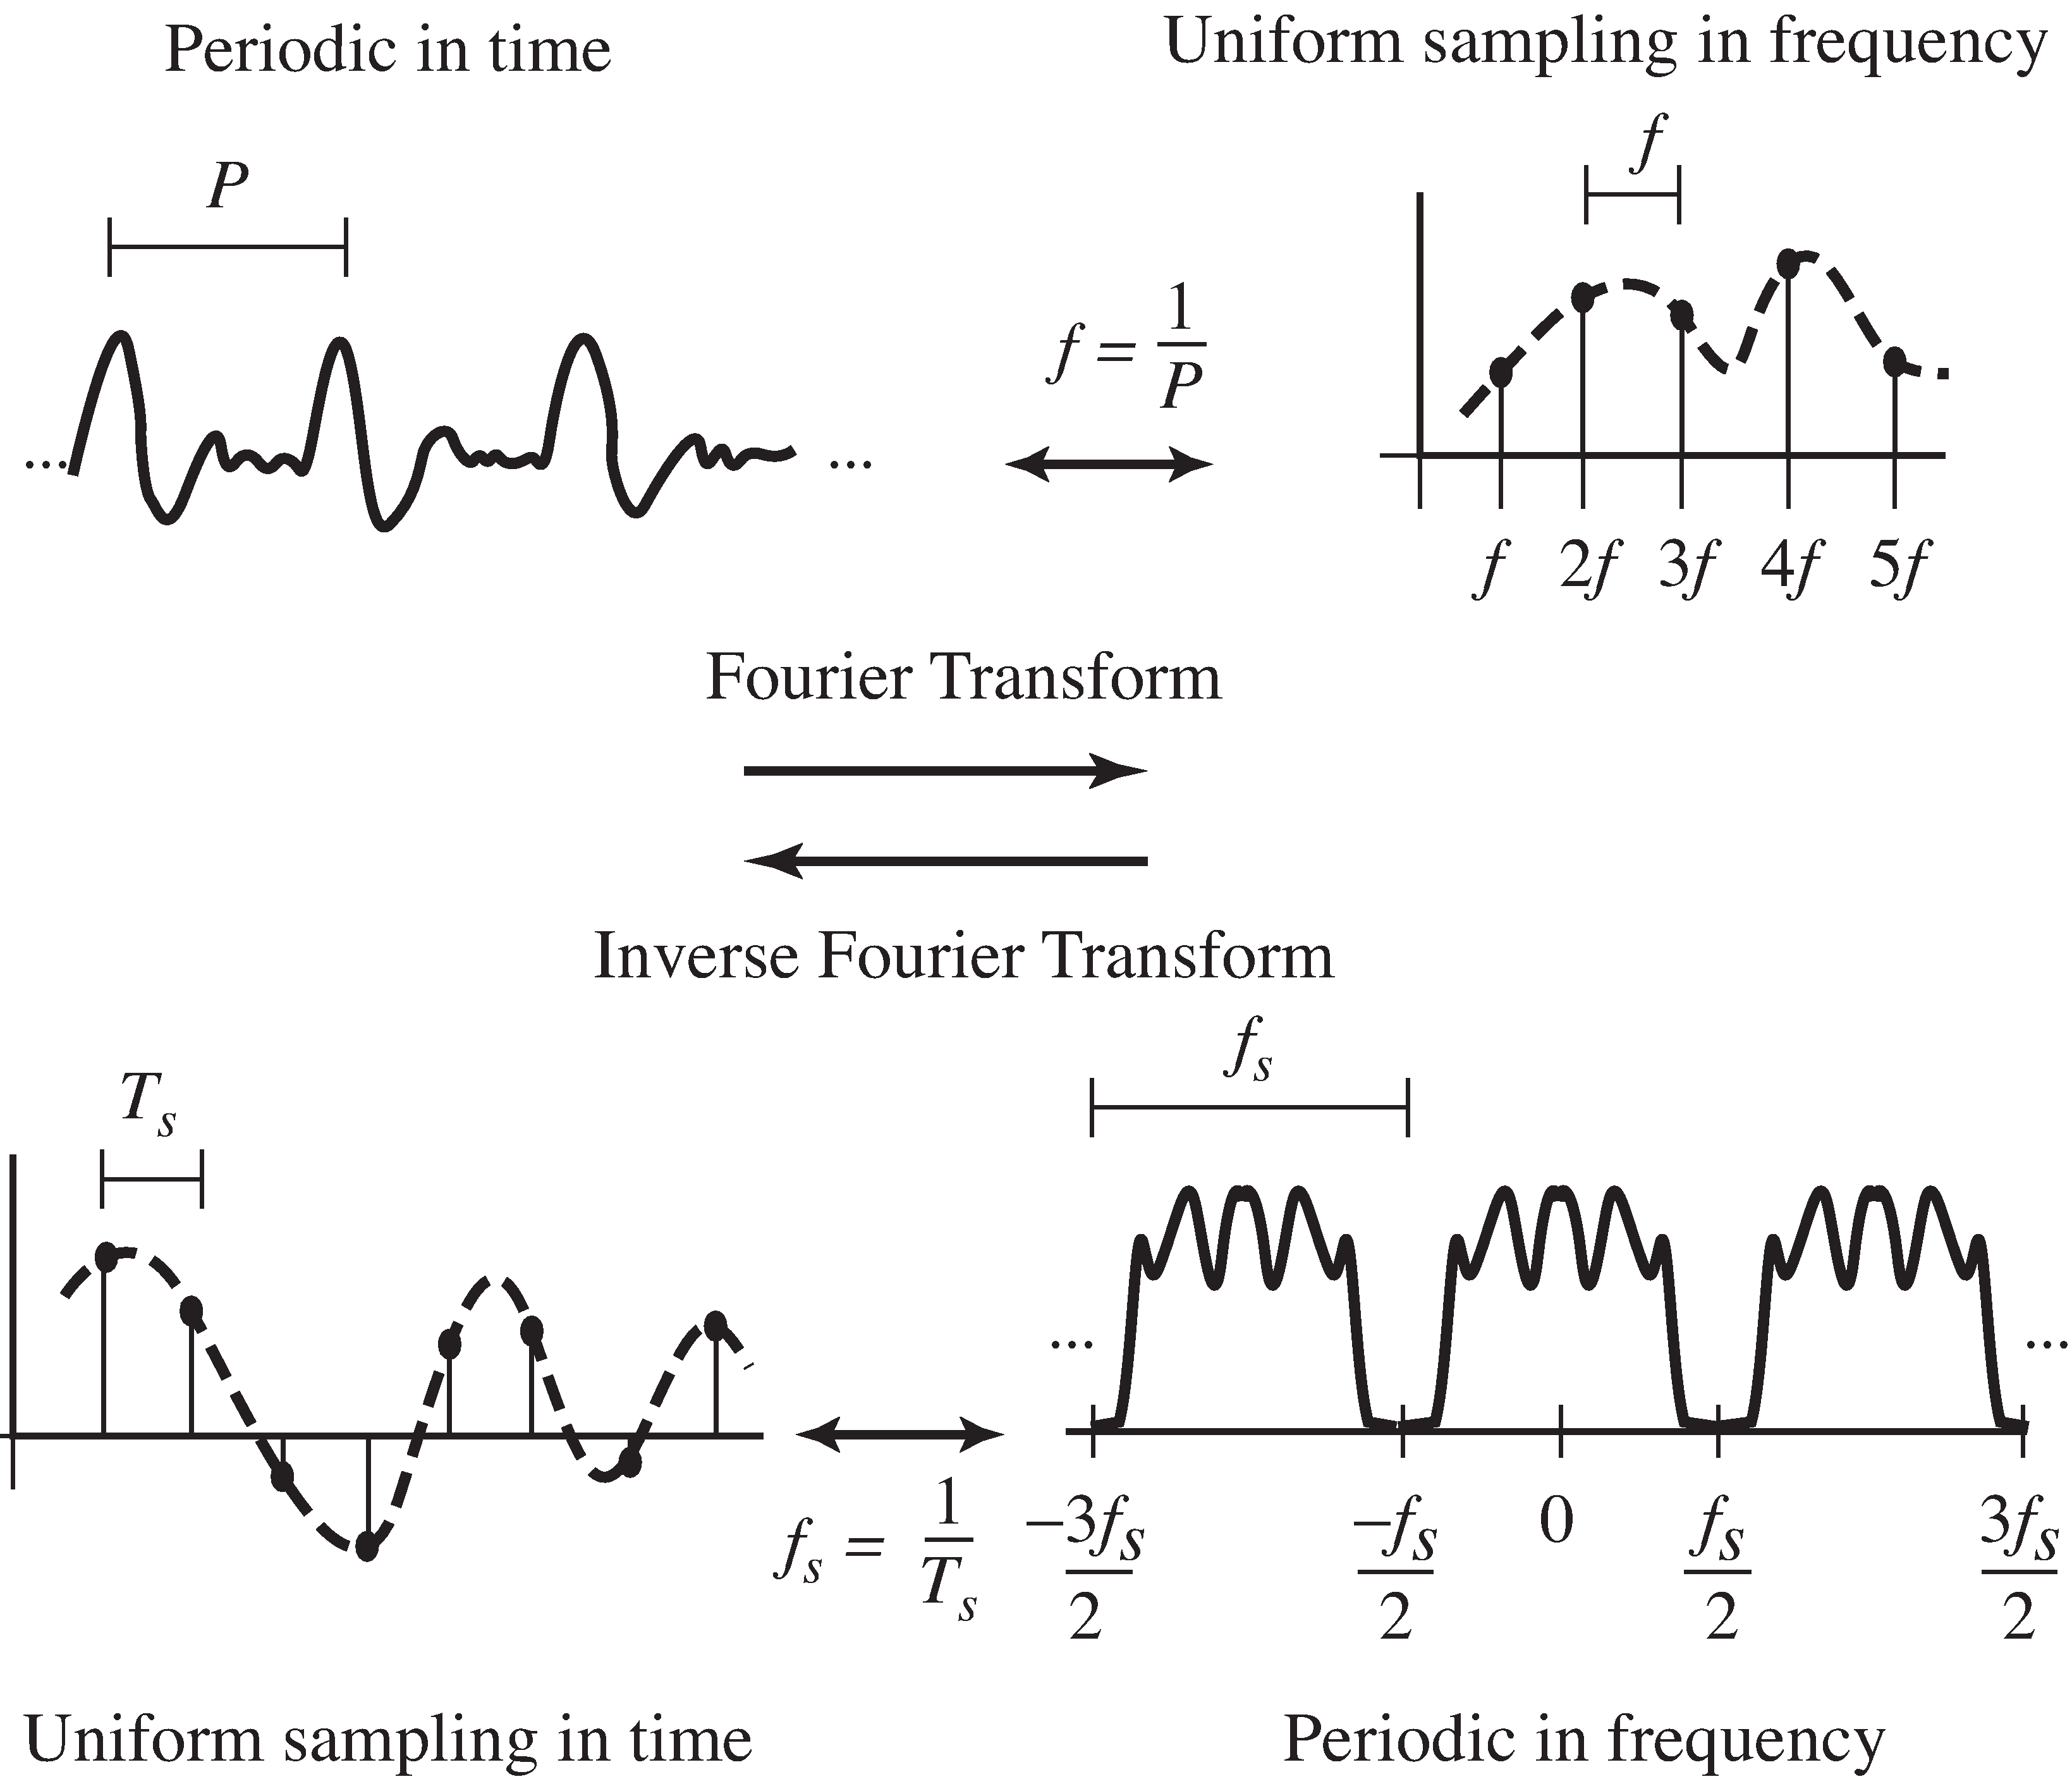
The basic insight from Fourier series is that any signal which is periodic in time can be reexpressed as a collection of uniformly spaced spikes infrequency; that is,
The same arguments show the basic result of sampling, which is that
Thus, whenever a signal is uniformly sampled in time (say, with sampling interval seconds), the spectrum will be periodic; that is, it will repeat every Hz.
Two conventions are often observed when drawing periodic spectra that arise from sampling. First,the spectrum is usually drawn centered at 0 Hz. Thus, if the period of repetition is , this is drawn from to , rather than from 0 to . This makes sense because the spectra of individual real valuedsinusoidal components contain two spikes symmetrically located around 0 Hz(as we saw in "The First Element: Oscillators" ). Accordingly, the highest frequency that can be representedunambiguously is , and this frequency is often called the Nyquist frequency .
The second convention is to draw only one period of the spectrum. After all, the others are identical copies that contain no newinformation. This is evident in the bottom right diagram of [link] where the spectrum between and is the same as the spectrum between and . In fact, we have been observing this convention throughoutsections "The First Element: Oscillators" and "The Second Element: Linear Filters" , since all of the figures of spectra (Figures [link] , [link] , [link] , and [link] ) show just one period of the complete spectrum.
Perhaps you noticed that
plotspec.m changes the frequency
axis when the sampling interval
Ts is changed.
(If not, go back and redo Exercise
[link] (c).)
By the second convention,
plotspec.m shows exactly one period of the
complete spectrum. By the first convention, the plots are labelledfrom
to
.
What happens when the frequency of the signal is too high for the sampling rate? The representation becomes ambiguous.This is called aliasing , and is investigated by simulation in the problems below.Aliasing and other sampling-related issues (such as reconstructing an analog signal from its samples) arecovered in more depth in Chapter [link] .
Closely related to the digital sampling of an analog signal is the (digital) downsampling of a digital signal, whichchanges the rate at which the signal is represented. The simplest case downsamples by a factor of , removing all but one out of every samples. This can be written
where is an integer between 0 and . For example, with and , is the sequence that consists of every third value of ,
This is commonly drawn in block form as in [link] . If the spectrum of is bandlimited to of the Nyquist rate, then downsampling by loses no information. Otherwise, aliasing occurs. Like analog-to-digital sampling,downsampling is a time varying operation.
Notification Switch
Would you like to follow the 'Software receiver design' conversation and receive update notifications?

|
|

|
|

|
|

|
|

|
|

|
|

|
|

|
|
|
|
|

|