

| << Chapter < Page | Chapter >> Page > |
Mimic the code in
filternoise.m to create a filter
that
Change the sampling rate to
Ts=1/20000 .
Redesign the three filters from Exercise
[link] .
Let
be a cosine wave of frequency
,
be a cosine wave of frequency
, and
be a cosine wave of frequency
.
Let
.
Use
as input to each of the three filters in
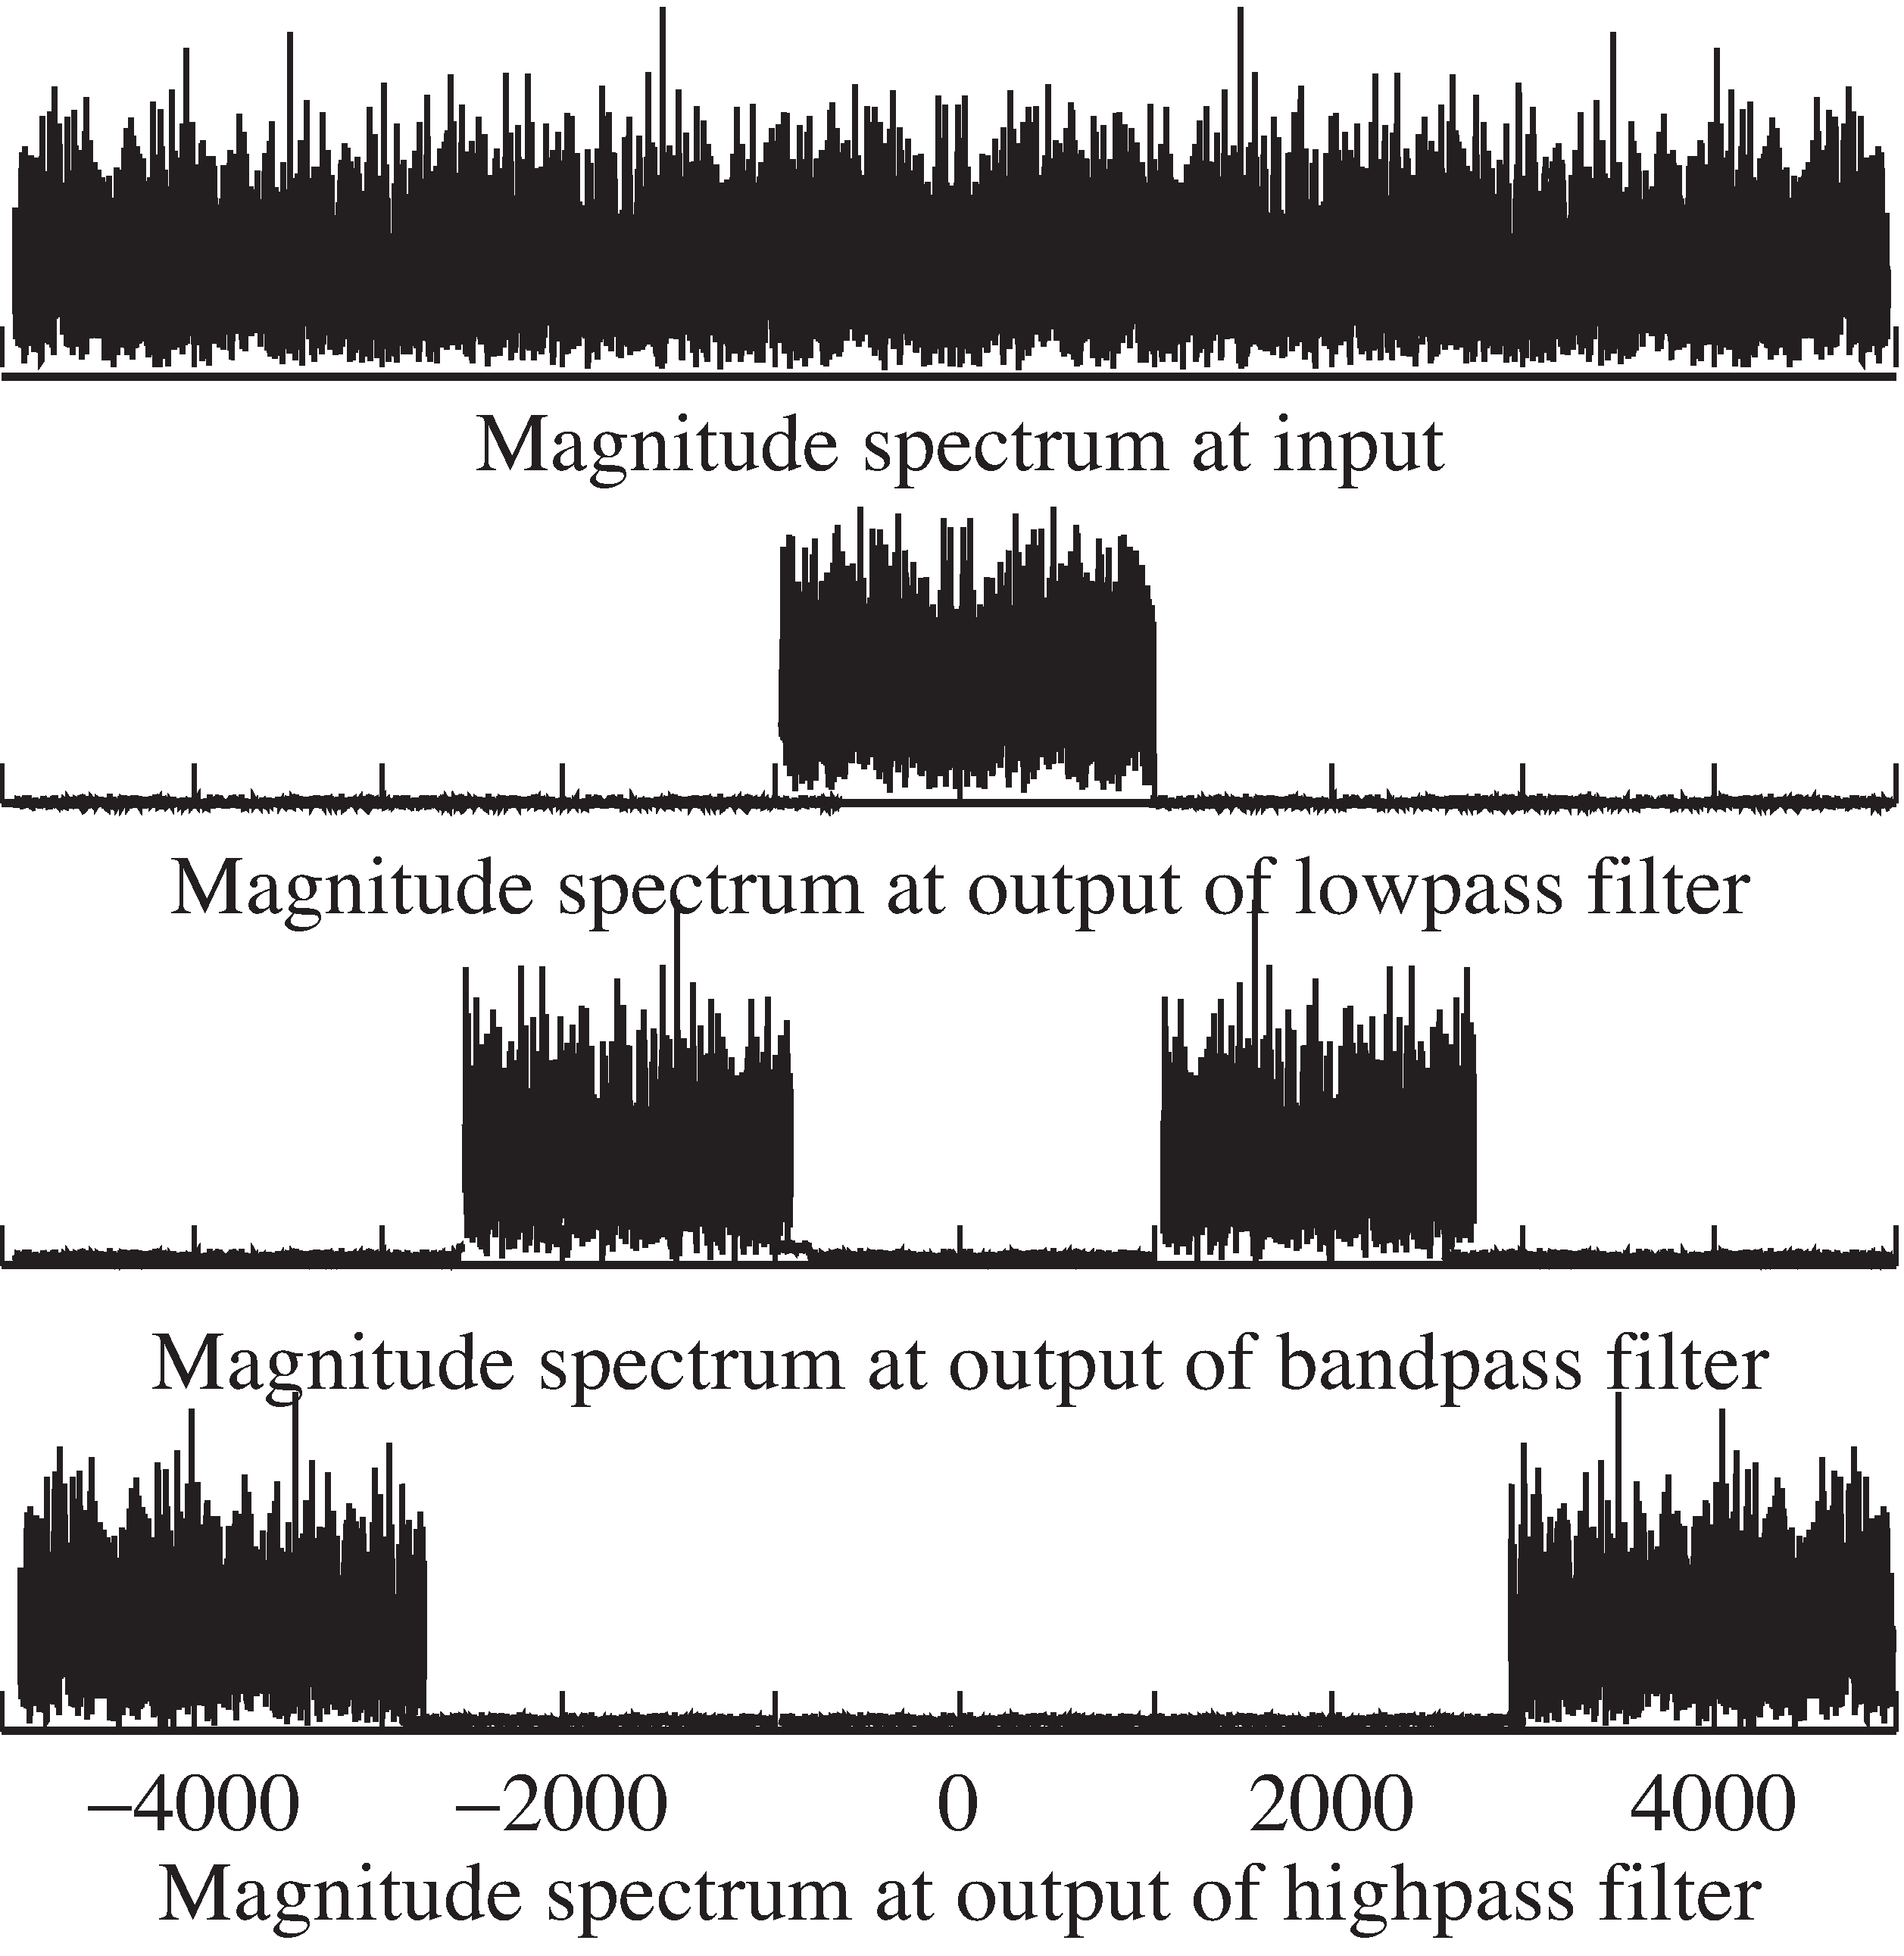
filternoise.m . Plot the spectra, and explain what you see.
TRUE or FALSE: A linear, time-invariant system exists that has input and output with and . Explain.
TRUE or FALSE: Filtering a passband signal with absolute bandwidth through certain fixed linear filters can result in an absolute bandwidth of the filter outputgreater than . Explain.
TRUE or FALSE: A linear, time-invariant, finite-impulse-response filter with a frequency response having unit magnitudeover all frequencies and a straight-line, sloped phase curve has as its transfer function a pure delay.Explain.
TRUE or FALSE: Processing a bandlimited signal through a linear, time-invariantfilter can increase its half-power bandwidth. Explain.
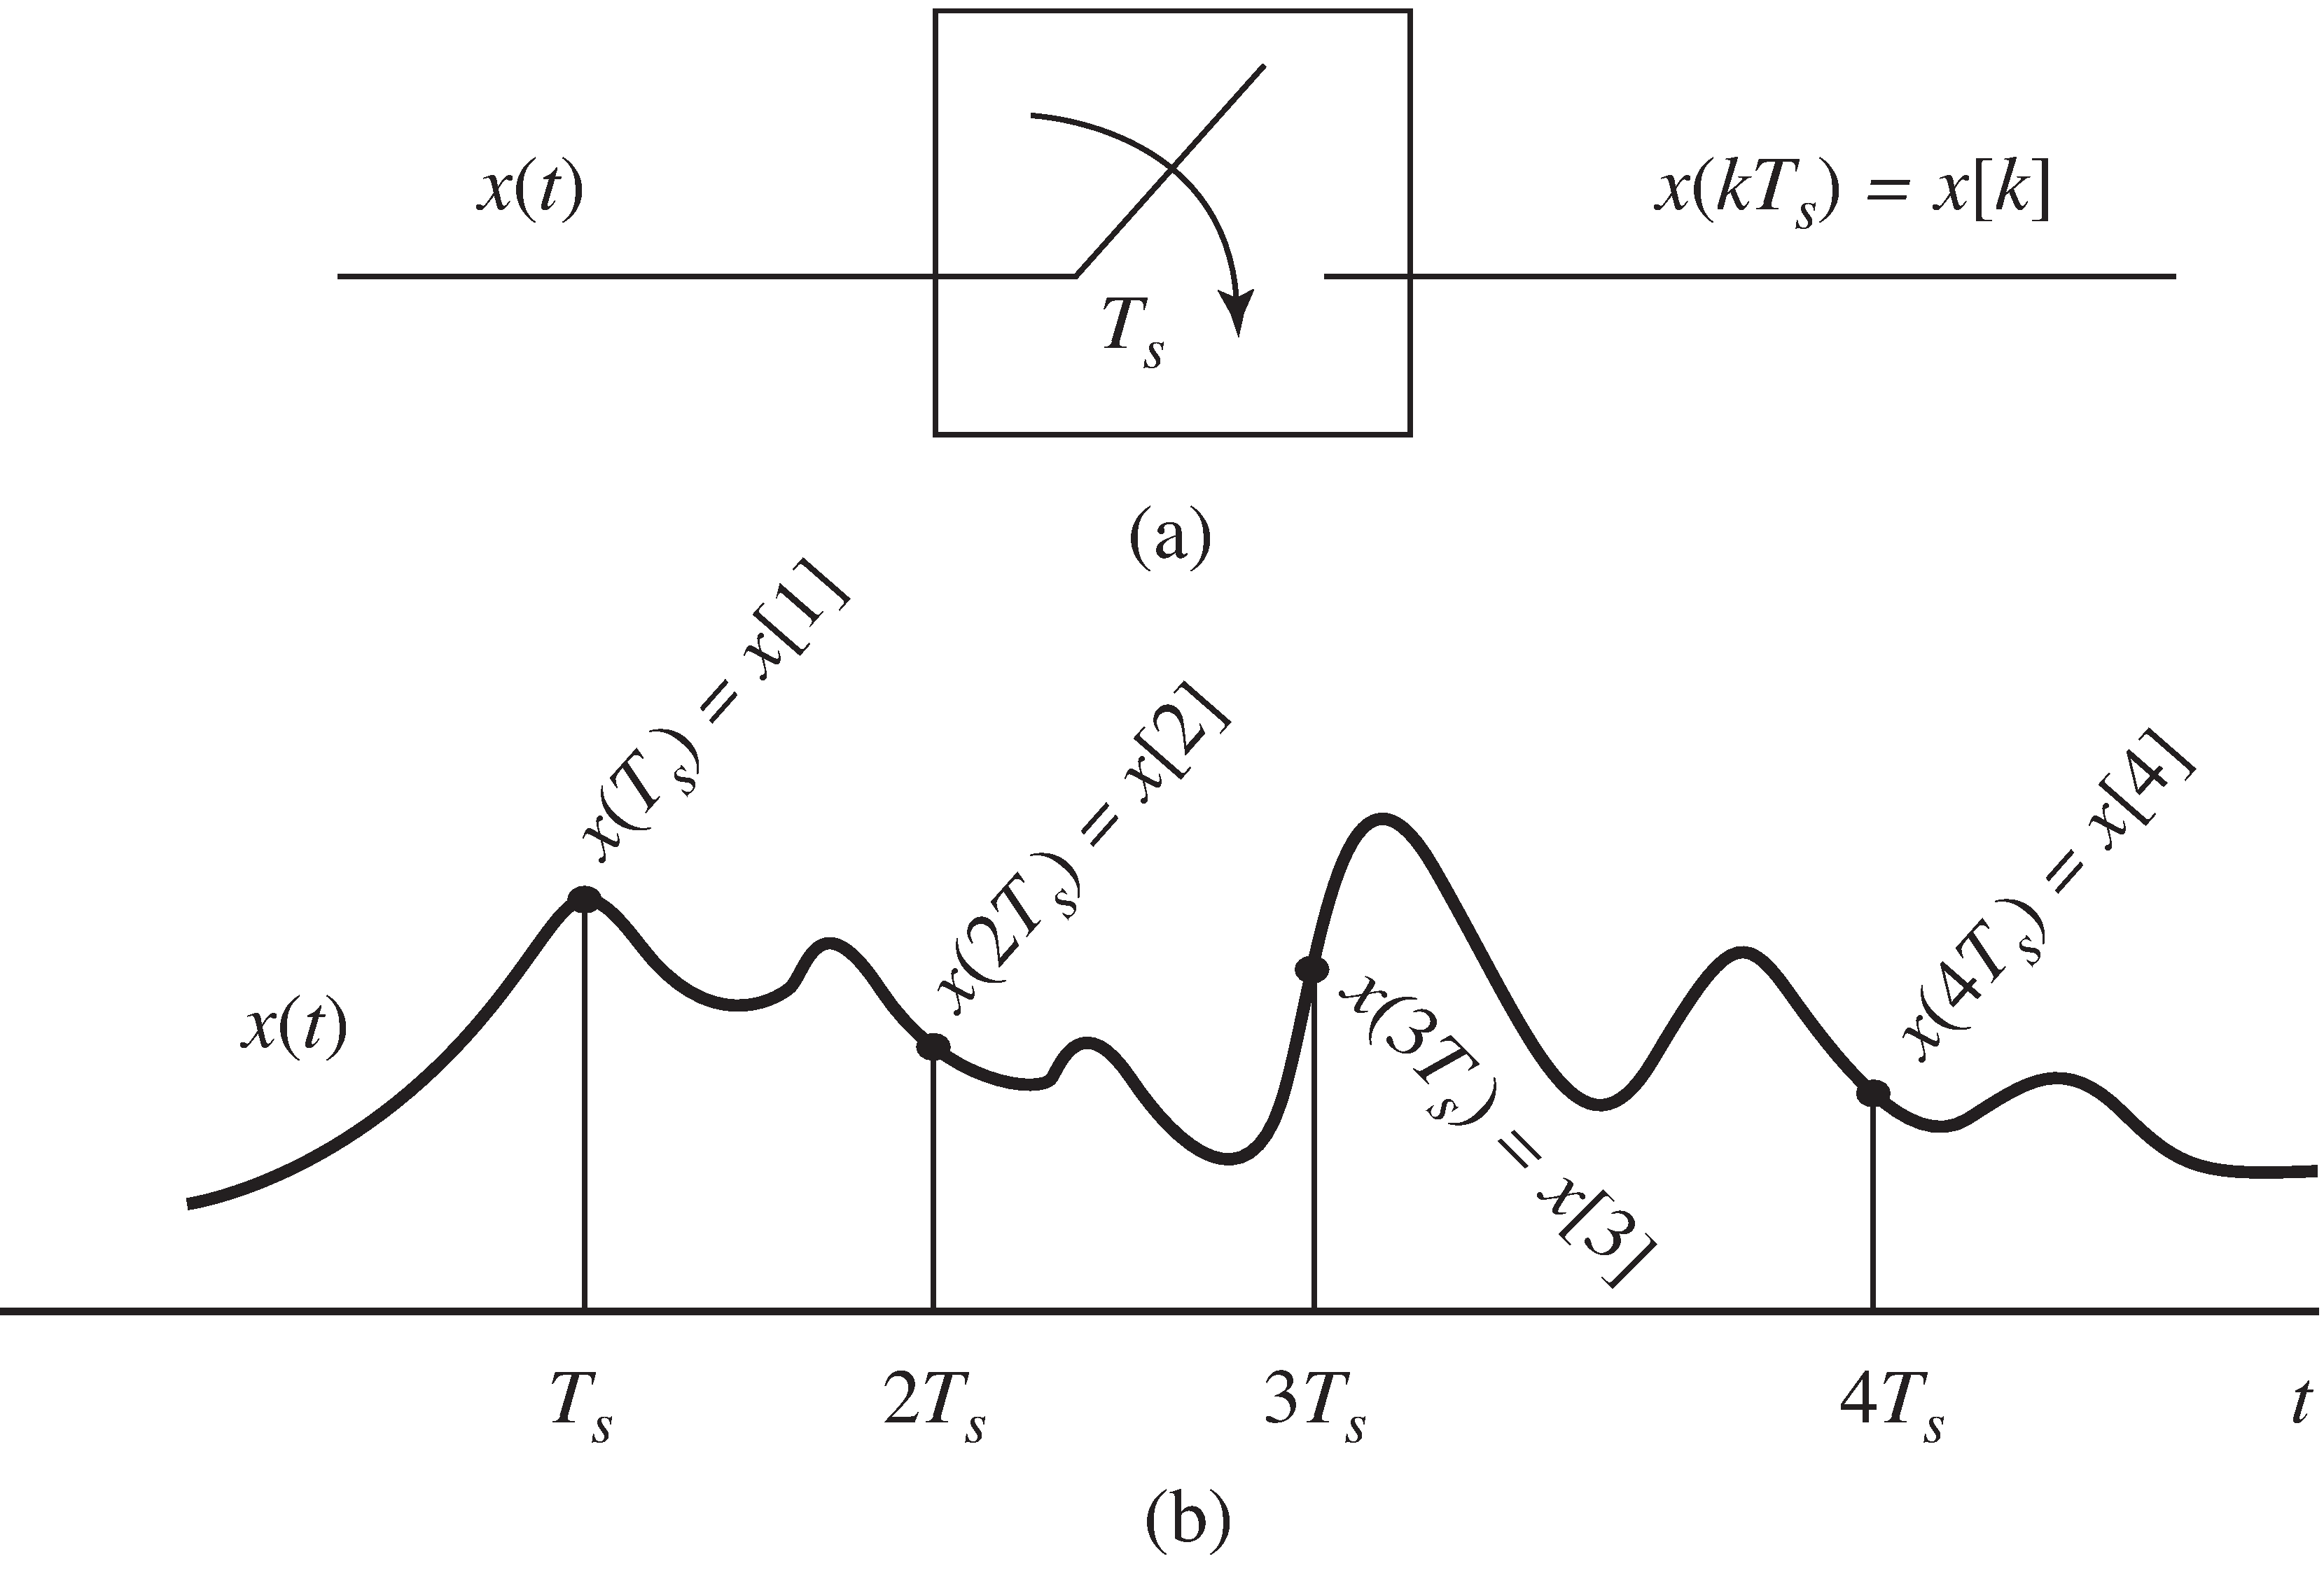
Since part of any digital transmission system is analog (transmissions through the air, across a cable, oralong a wire, are inherently analog), and part of the system is digital,there must be a way to translate the continuous-time signal into a discrete-time signal and vice versa. The process of sampling an analogsignal, sometimes called analog-to-digital conversion, is easy to visualize in the time domain. [link] shows how sampling can be viewed as the process of evaluating a continuous-time signal ata sequence of uniformly spaced time intervals, thus transforming the analog signal into the discrete-time signal .
One of the key ideas in signals and systems is the Fourier series: a signalis periodic in time (it repeats every seconds), if and only if the spectrum can be written as a sum ofcomplex sinusoids with frequencies at integer multiples of a fundamental frequency . Moreover, this fundamental frequency can be written in terms ofthe period as . Thus, if a signal repeats 100 times every second ( seconds), then its spectrum consists of a sum of sinusoids with frequencies Hz.
Conversely, if a spectrum is built from a sum of sinusoids with frequencies Hz, then it must represent a periodic signal in time that has period . Said another way, the nonzero portions of the spectrum areuniformly spaced Hz apart. This uniform spacing can be interpreted as a sampling (in frequency) of an underlyingcontinuous-valued spectrum. This is illustrated in the top portion of [link] , which shows the time domain representation on the left and the correspondingfrequency domain representation on the right.
Notification Switch
Would you like to follow the 'Software receiver design' conversation and receive update notifications?

|
|

|
|

|
|

|
|

|
|

|
|

|
|

|
|

|
|

|