| << Chapter < Page | Chapter >> Page > |
To study this question, we return to our familiar apparatus for studying vapor pressure. Consider trapping a quantity of liquid in a cylinder with a piston, which is then pulled back to create a volume above the liquid. We then measure the pressure in that volume, which is the pressure created by the vapor in equilibrium with the liquid. Recall that the pressure we observe is independent of the volume of liquid we trap, so long as there is some liquid remaining in the cylinder, or as long as the liquid does not all evaporate.
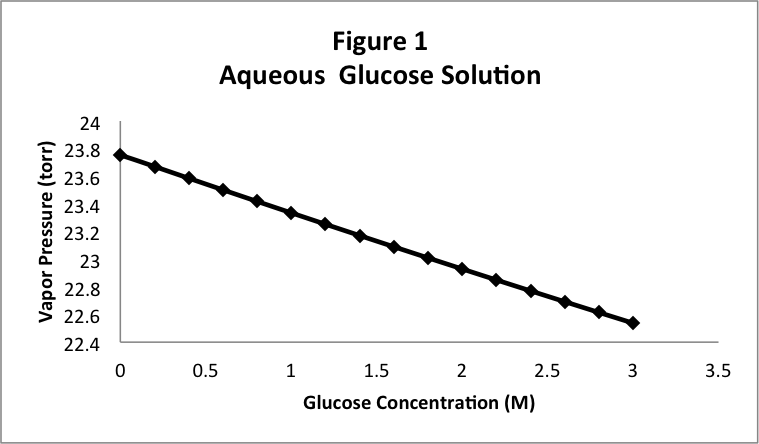
In this case, instead of trapping pure water in the cylinder, we will trap a solution of glucose in water. Just to be quantitative, we’ll make this a 1.0 M solution of glucose. Recall that the vapor pressure of pure water at 25 ºC is 23.756 torr. When we measure the vapor pressure of the glucose solution, we find a different value, 23.33 torr, lower than the vapor pressure of the pure water. To check this, we measure the vapor pressure of a 2.0 M glucose solution , and we observe 22.93 torr. Note that the higher concentration has an even lower vapor pressure. If we look at these numbers carefully, we notice that the amount by which the vapor pressure was lowered for the 2.0 M solution (0.82 torr) seems to be about double the lowering for the 1.0 M solution (0.42 torr). To verify this trend, we can try several solutions and plot the vapor pressure as a function of the concentration of the glucose solution. The result is shown in Figure 1, where the vapor pressure appears to decrease in a linear fashion as we increase the concentration of glucose.

It isn’t obvious just from looking, but the graph in Figure 1 is not exactly a straight line. It curves slightly. It isn’t obvious either that we can get a better straight line by changing the way in which the concentration of the glucose is measured. Instead of using the molarity (moles per liter), we can measure the “mole fraction” of the glucose, defined by:
X glucose =n glucose /(n glucose +n water )
Note that the mole fraction is, as the name suggests, the fraction of the total number of moles of substance that is glucose. If we plot the vapor pressure of the glucose solutions as a function of the mole fraction of glucose, we get the graph in Figure 2, which essentially turns out to be a perfectly straight line.

Based on the graph in Figure 2, we can say that the vapor pressure of the glucose solution is a linear function of the mole fraction of the glucose in the solution. With a little work, we can show that the line in Figure 2 is described by the equation:
P vap =P * vap *(1-X glucose )
where P vap * is the vapor pressure of the pure water. This means that it is only the number of moles of glucose that affects the vapor pressure of the solution. If we look back at the definition of mole fraction, we can see that the mole fraction of glucose plus the mole fraction of water must equal 1. This means that X glucose + X water = 1, so we can rewrite the above equation as:
P vap =P * vap *X water
This is a somewhat unexpected result: glucose seems to be absent from the equation! In fact, it is present, but only in the expression for the mole fraction of water

Notification Switch
Would you like to follow the 'Concept development studies in chemistry 2013' conversation and receive update notifications?