

| << Chapter < Page | Chapter >> Page > |
Let’s stop to think about why this is true at 1 atm pressure. To do so, we need to remember how we observed the boiling point. We applied a pressure using a piston which trapped a liquid in a cylinder. When we elevated the temperature, we observed a phase transition at one temperature which we called the boiling point. At that point, the vapor became stable. For this to be true, the pressure created by the vapor (which is of course the vapor pressure) must at least be equal to the pressure applied externally to the piston. If the vapor pressure is less than the applied pressure, the vapor cannot resist the applied pressure, the piston moves in, and all of the vapor condenses into the liquid. Therefore, for the liquid to boil, the temperature must be high enough for the vapor pressure to equal the applied pressure. Only at this temperature or above will the rate of evaporation be great enough to offset the rate of condensation created by the externally applied pressure.
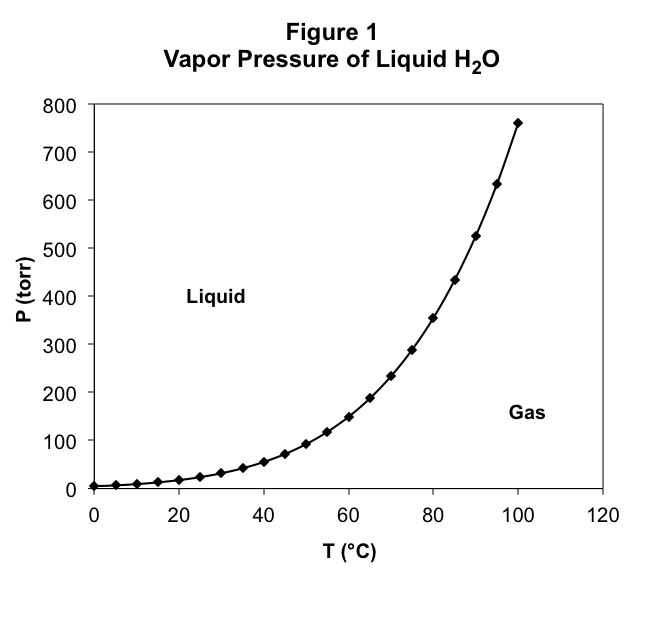
To find the boiling point temperature at 1 atm pressure, we need to find the temperature at which the vapor pressure is 1 atm. To do so, we find the point on the graph where the vapor pressure is 1 atm and read off the corresponding temperature, which must be the boiling point. Of course, this will work at any given pressure. We just read off of Figure 1 the temperature at which the vapor pressure equals the applied pressure, and that will be the temperature at which the liquid boils at that pressure. This means that Figure. 1 gives us both the vapor pressure of water as a function of the temperature and the boiling point temperature of water as a function of the applied pressure. They are the same graph!
Remember that in the experiment, at the boiling point we observed that both liquid and gas are at equilibrium with one another. Both phases are present at the boiling point. This is true at every combination of applied pressure and boiling point temperature. Therefore, for every combination of temperature and pressure along the curve on the graph in Figure 1, we observe liquid-gas equilibrium.
What happens at combinations of temperature and pressure which are not on the line drawn in Figure 1? To find out, let’s run the experiment. We first start at any temperature-pressure combination on the curve and elevate the temperature while holding the applied pressure constant. In Figure 1, this moves us to the right of the curve. We observe that all of the liquid vaporizes, and there is only gas in the container. What happened to the equilibrium? At higher temperature, the vapor pressure of the liquid rises, but if the applied pressure does not also increase, then the vapor pressure will be greater than the applied pressure. The vapor pushes back the piston and the liquid evaporates. We must therefore not be at equilibrium anymore. For all temperature and pressure combinations to the right of the curve, only vapor exists.
Now let’s start at a point on the curve and lower the temperature while holding the pressure constant, leaving us to the left of the curve. We observe that all of the gas condenses into the liquid. This is because the vapor pressure is below the applied pressure, and the piston moves in against the gas until it all condenses into the liquid. For all temperature and pressure combinations to the left of the curve, only liquid exists.
Notification Switch
Would you like to follow the 'Concept development studies in chemistry 2013' conversation and receive update notifications?

|
|

|
|

|
|

|
|

|
|

|
|

|
|

|
|

|
|

|